matplotlib latex表格
使用python3环境
import matplotlib.gridspec as gridspec
import matplotlib.pyplot as pltimport numpy as np
import matplotlib as mpl
#mpl.use('pgf')def figsize(scale, nplots = 1):fig_width_pt = 390.0                          # Get this from LaTeX using \the\textwidthinches_per_pt = 1.0/72.27                       # Convert pt to inchgolden_mean = (np.sqrt(5.0)-1.0)/2.0            # Aesthetic ratio (you could change this)fig_width = fig_width_pt*inches_per_pt*scale    # width in inchesfig_height = nplots*fig_width*golden_mean              # height in inchesfig_size = [fig_width,fig_height]return fig_sizepgf_with_latex = {                      # setup matplotlib to use latex for output"pgf.texsystem": "xelatex",        # change this if using xetex or lautex"text.usetex": True,                # use LaTeX to write all text"font.family": "serif","font.serif": [],                   # blank entries should cause plots to inherit fonts from the document"font.sans-serif": [],"font.monospace": [],"axes.labelsize": 10,               # LaTeX default is 10pt font."font.size": 10,"legend.fontsize": 8,               # Make the legend/label fonts a little smaller"xtick.labelsize": 8,"ytick.labelsize": 8,"figure.figsize": figsize(1.0),     # default fig size of 0.9 textwidth"pgf.preamble": "\n".join([r"\usepackage[utf8x]{inputenc}",    # use utf8 fonts becasue your computer can handle it :)r"\usepackage[T1]{fontenc}",        # plots will be generated using this preamble]),}
mpl.rcParams.update(pgf_with_latex)
# gs2 = gridspec.GridSpec(1, 2)
# gs2.update(top=1-2/3-0.05, bottom=0, left=0.15, right=0.85, wspace=0.0)ax = plt.subplot()
ax.axis('off')
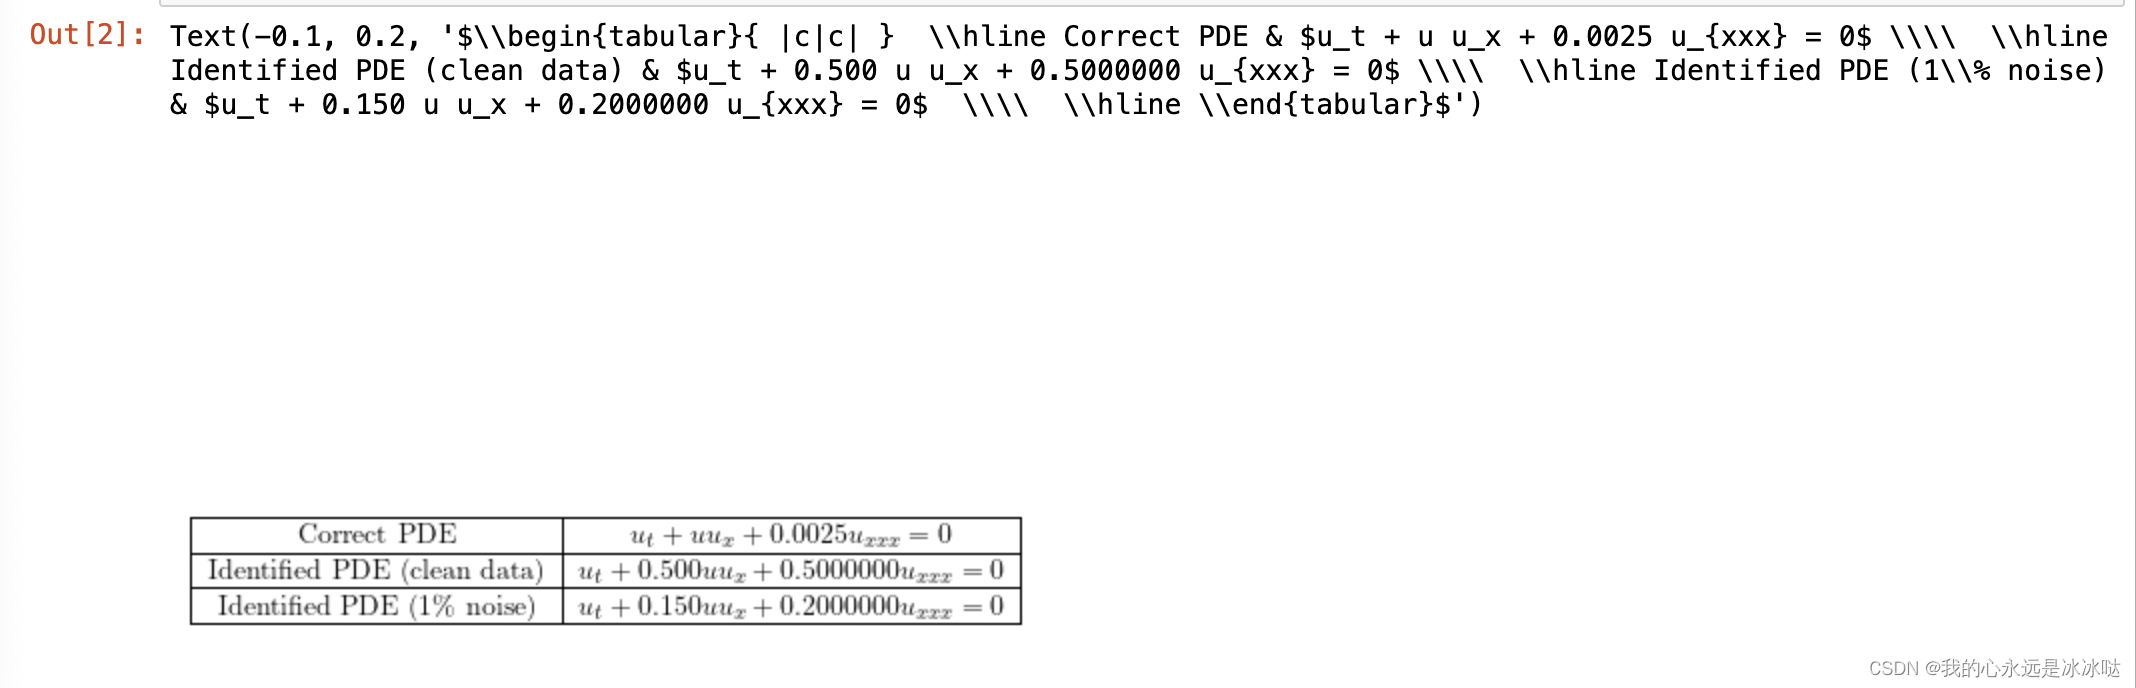
s1 = r'$\begin{tabular}{ |c|c| } \hline Correct PDE & $u_t + u u_x + 0.0025 u_{xxx} = 0$ \\ \hline Identified PDE (clean data) & '
s2 = r'$u_t + %.3f u u_x + %.7f u_{xxx} = 0$ \\ \hline ' % (0.5,0.5)
s3 = r'Identified PDE (1\% noise) & '
s4 = r'$u_t + %.3f u u_x + %.7f u_{xxx} = 0$ \\ \hline ' % (0.15, 0.2)
s5 = r'\end{tabular}$'
s = s1+s2+s3+s4+s5
ax.text(-0.1,0.2,s)
结果如下