3d旋转相册代码源码_Qt Data Visualization ,让数据3D可视化
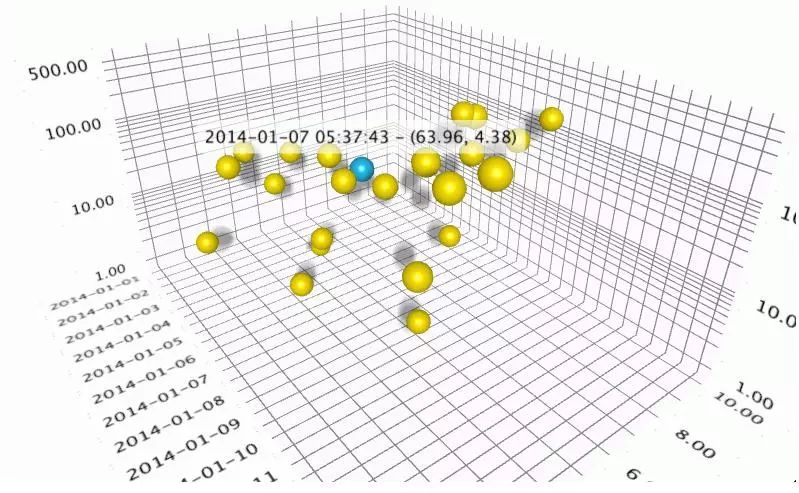
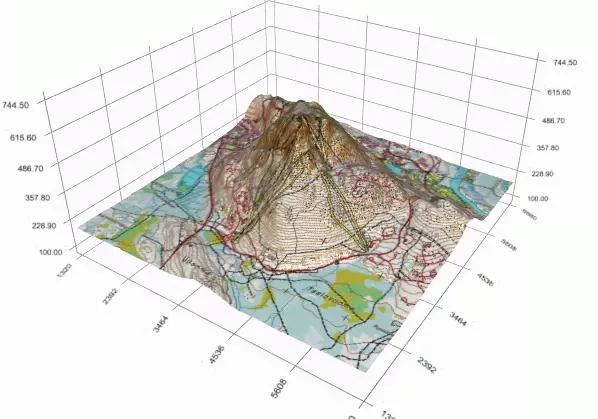
在前面我们已经见识了Qt Charts可以非常简单地实现常见的图表,但Qt Charts只能显示平面图,如果想更进一步,让数据以3D形式进行显示,该怎么实现呢?在Qt中提供的Qt Data Visualization模块可以帮助我们快速创建3D柱形图、散点和曲面图。下面是Qt自带示例程序的效果。
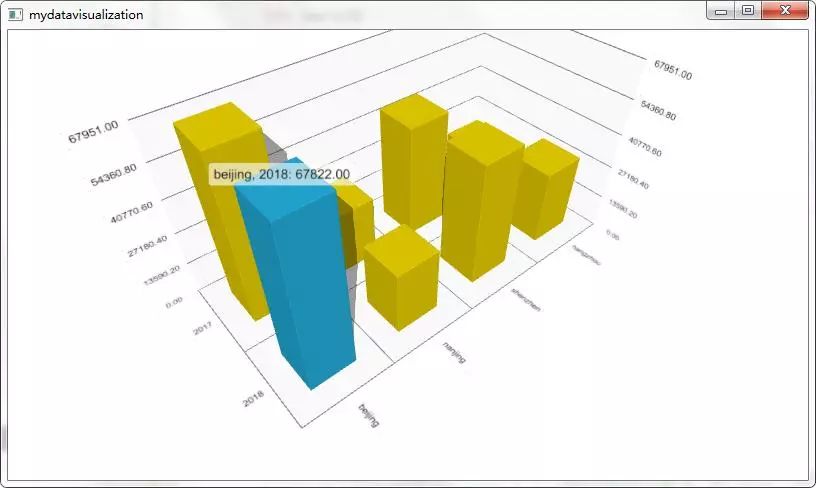
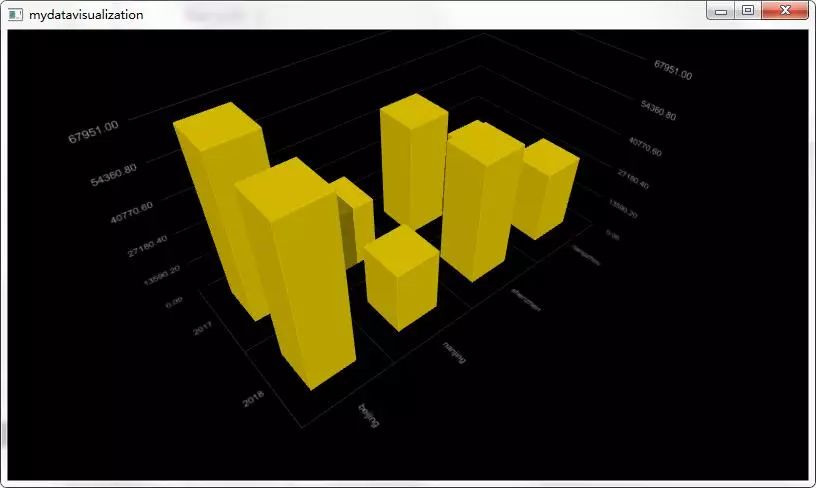
今天我们来演示一个3D柱形图,实现柱形图的动态展示功能。先看下最后效果。
如果没啥感觉,那就看看动态效果吧。


开发环境:Win 7 + Qt 5.12.0(注意:在安装Qt时需要选择安装Qt Data Visualization模块)
实现基本的柱形图首先新建空的Qt Quick应用。将main.qml内容修改如下:
import QtQuick 2.9
import QtQuick.Window 2.2
import QtDataVisualization 1.2

Window {
    visible: true
    width: 800
    height: 450

    Bars3D {
        id: bars3D
        width: parent.width
        height: parent.height
        theme: Theme3D { type: Theme3D.ThemePrimaryColors}
        scene.activeCamera.xRotation : 40.0
        scene.activeCamera.yRotation : 45.0

        Bar3DSeries {
            id: series
            itemLabelFormat: "@colLabel, @rowLabel: @valueLabel"
            ItemModelBarDataProxy {
                itemModel: dataModel
                rowRole: "year"
                columnRole: "city"
                valueRole: "expenses"
            }
        }
    }

    ListModel {
        id: dataModel
        ListElement{ year: "2018"; city: "beijing";  price: "67822"; }
        ListElement{ year: "2018"; city: "nanjing";  price: "26714"; }
        ListElement{ year: "2018"; city: "shenzhen"; price: "50900"; }
        ListElement{ year: "2018"; city: "hangzhou"; price: "30729"; }
        ListElement{ year: "2017"; city: "beijing";  price: "67951"; }
        ListElement{ year: "2017"; city: "nanjing";  price: "26127"; }
        ListElement{ year: "2017"; city: "shenzhen"; price: "46879"; }
        ListElement{ year: "2017"; city: "hangzhou"; price: "22934"; }
    }
}
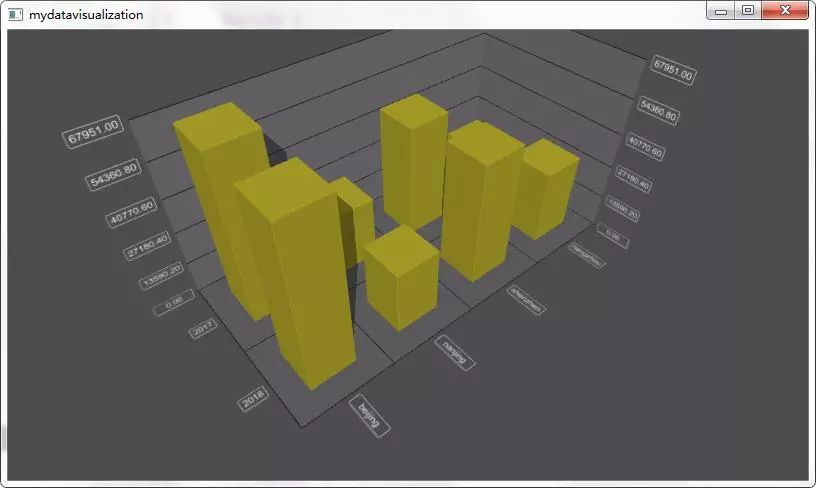
这里只需要指定Bars3D、Bar3DSeries两个类型就可以实现3D柱形图,前者用来渲染3D柱形图,后者用来指定具体的图形系列,在一个Bars3D里面可以定义多个系列。scene.activeCamera用来设置场景相机,这里指定了X、Y轴上的旋转角度,这样可以更好地显示图表。ItemModelBarDataProxy用来将下面ListModel中的数据映射到图形系列中,简单来说就是在3D坐标轴中X、Y、Z轴分别对应哪些数据,这里通过rowRole、columnRole和valueRole三个属性来指定。itemLabelFormat用来设置点击一个具体的柱形时显示标签的格式。通过下面的运行效果图,可以更加清楚地看到它们的对应关系。
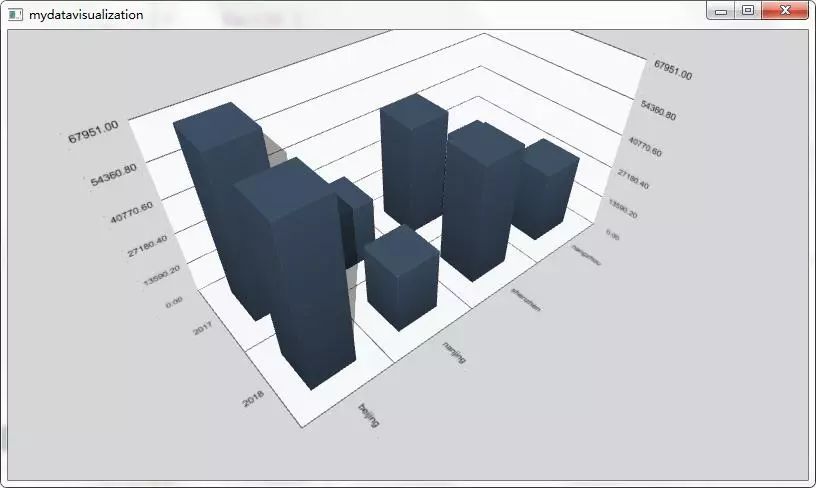
这里使用theme属性指定了3D柱形图的主题样式,咱们使用了现成的主题。Qt自带了9个现成可用的主题,部分效果如下图所示。
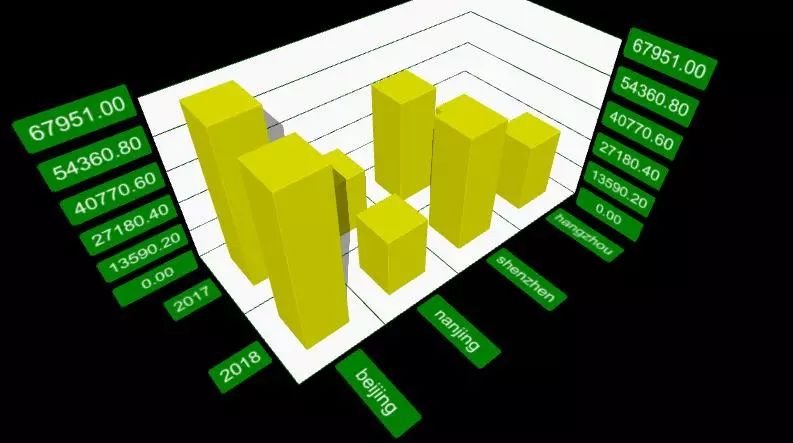
 使用自定义主题
很多时候自带的主题并不能满足我们的需求,这时就需要自定义主题。在根对象中添加如下代码:
ThemeColor {
    id: dynamicColor
    color: "yellow"
}

Theme3D {
    id: dynamicColorTheme
    type: Theme3D.ThemeEbony
    baseColors: [dynamicColor]
    font.pointSize: 50
    labelBorderEnabled: false
    labelBackgroundColor: "green"
    labelTextColor: "white"
    backgroundColor: "white"
    gridLineColor: "green"
}
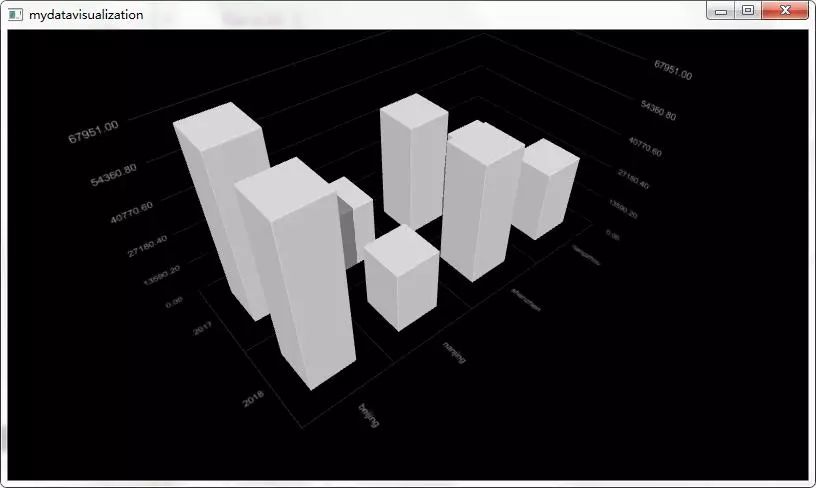
这里通过Theme3D来定义一个3D主题,我们指定了type为现成的themeEbony主题,表明是基于该主题进行修改的。baseColors属性用来指定所有图形系列的颜色,它是一个列表,其中使用ThemeColor类型来指定颜色,因为我们现在只有一个系列,所有只指定了dynamicColor一个颜色。
下面将前面Bars3D对象的theme属性更改为:
theme: dynamicColorTheme
这时运行程序,效果如下图所示。
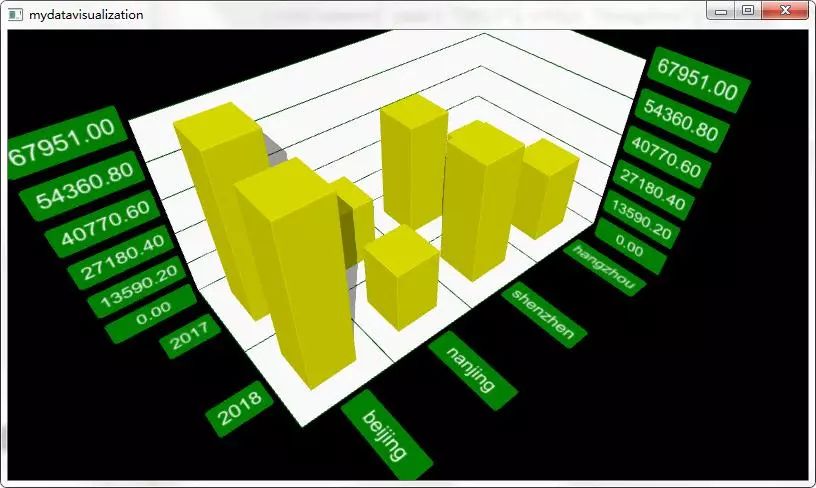
为了更好地展示3D效果,我们使用顺序动画组执行了一系列动画,在根对象最后添加如下代码:
SequentialAnimation {
    id: cameraAnimation
    running: true

    NumberAnimation {
        target: bars3D.scene.activeCamera
        property:"xRotation"
        from: 40.0; to: 10.0
        duration: 4000
        easing.type: Easing.InOutBack
    }

    NumberAnimation {
        target: bars3D.scene.activeCamera
        property:"yRotation"
        from: 5.0; to: 45.0
        duration: 3000
        easing.type: Easing.InQuart
    }

    ColorAnimation { target:  dynamicColor;
        property: "color";
        to: "red"; duration: 2000;
        easing.type: Easing.InCirc}
    ColorAnimation {target:  dynamicColor;
        property: "color";
        to: "yellow"; duration: 2000;
        easing.type: Easing.OutCirc}

    NumberAnimation {
        target: bars3D.scene.activeCamera
        property:"xRotation"
        from: 10.0; to:40.0
        duration: 2000
        easing.type: Easing.OutQuad
    }

    ColorAnimation { target:  dynamicColorTheme;
        property: "labelBackgroundColor";
        to: "green"; duration: 1000 ;
        easing.type: Easing.OutQuad}
    ColorAnimation { target:  dynamicColorTheme;
        property: "labelTextColor";
        to: "white"; duration: 1000 ;
        easing.type: Easing.OutQuad}
    ColorAnimation { target:  dynamicColorTheme;
        property: "backgroundColor";
        to: "white"; duration: 1000;
        easing.type: Easing.OutQuad }
    ColorAnimation {target:  dynamicColorTheme;
        property: "gridLineColor";
        to: "green"; duration: 500;
        easing.type: Easing.OutQuad}

    NumberAnimation {
        target: bars3D.scene.activeCamera
        property:"zoomLevel"
        from: 75.0; to:95.0
        duration: 3000
        easing.type: Easing.InOutQuart
    }
}
这里通过NumberAnimation和ColorAnimation为相机旋转、图表颜色等添加动画效果,从而实现了动态显示3D图表的效果。为了更加炫酷,我们在执行动画前,需要对图表的默认属性值进行一些修改。
1.将ThemeColor对象中:
color: "yellow"
一行代码注释或者删除掉;
2.将Theme3D对象中几个指定颜色的属性修改为透明:
labelBackgroundColor: "transparent"
labelTextColor: "transparent"
backgroundColor: "transparent"
gridLineColor: "transparent"
3.将Bars3D对象中定义相机的语句修改如下:
scene.activeCamera.xRotation: 45.0
scene.activeCamera.yRotation: 5.0
scene.activeCamera.zoomLevel: 75
现在运行程序,就可以看到最终效果了。
结语怎么样,是不是感觉用QML来实现这样炫酷的3D图表很简单呢?心动不如行动,抽时间打开Qt Creator,赶快来亲自测试下吧。因为这里只是新技术尝鲜演示,不是基础教程,所以如果有的小伙伴接受起来感觉困难,不要灰心,可以等我们后期的系列教程来从头学习。
如果需要下载源码,可以点击下面的
相关文章:
当QtCharts遇上QtGraphicalEffects,梦幻科技曲线!