集群外Prometheus 集群 k8s
一、部署规划
1、一台普通的机器 192.168.18.9
2、k8s 集群一台master节点 192.168.18.7
二、二进制部署Prometheus (192.168.18.9 )
下载并解压
cd /opt/
wget https://github.com/prometheus/prometheus/releases/download/v2.37.0/prometheus-2.37.0.linux-amd64.tar.gz
tar xvf prometheus-2.37.0.linux-amd64.tar.gz
创建软连接
ln -sv /opt/prometheus-2.37.0.linux-amd64 /opt/prometheus配置自动启动
--web.enable-lifecycle:配置热加载
cat /etc/systemd/system/prometheus.service
[Unit]
Description=Prometheus Server
Documentation=https://prometheus.io/docs/introduction/overview/
After=network.target

[Service]
Restart=on-failure
WorkingDirectory=/opt/prometheus/
ExecStart=/opt/prometheus/prometheus --config.file=/opt/prometheus/prometheus.yml --web.enable-lifecycle

[Install]
WantedBy=multi-user.target
提权
chmod 777 /etc/systemd/system/prometheus.service
启动
systemctl daemon-reload
systemctl start prometheus
systemctl enable prometheus
查看端口,启动 9090
netstat -tunlp- |grep prometheus
三、二进制部署 node_exporter (192.168.18.7)
node_exporter 是监控本机的基础设施信息状态的,node_exporter 目前支持二进制安装,和部署在k8s 中,二进制安装直接通过本地启动一个9100端口,并将基础设施信息放入127.0.0.1:9100/metrics 中,然后由Prometheus拉取。而部署在k8s 中,由 k8s 在每个运算节点上,启动node-exporters 的 pod,由此pod 去获取本地的基础设施信息放入pod_IP:9100/metrics 中,然后由Prometheus拉取。在这里我们直接给192.168.18.7部署二进制的node_exporter ,以便我们能看出效果。
安装node_exporter
cd /opt/
wget https://github.com/prometheus/node_exporter/releases/download/v1.3.1/node_exporter-1.3.1.linux-amd64.tar.gz
tar xvf node_exporter-1.3.1.linux-amd64.tar.gz
ln -sv /opt/node_exporter-1.3.1.linux-amd64 /opt/node_exporter
启动
cd /opt/node_exporter
./node_exporter测试访问本机的192.168.18.7:9100/metrics

修改192.168.18.9 机器的 prometheus.yml,添加主机 192.168.18.7 端口号 9100
vim /opt/prometheus/prometheus.yml
    static_configs:
      - targets: ["localhost:9090","192.168.18.7:9100"]
热加载192.168.18.9 机器的 prometheus 配置
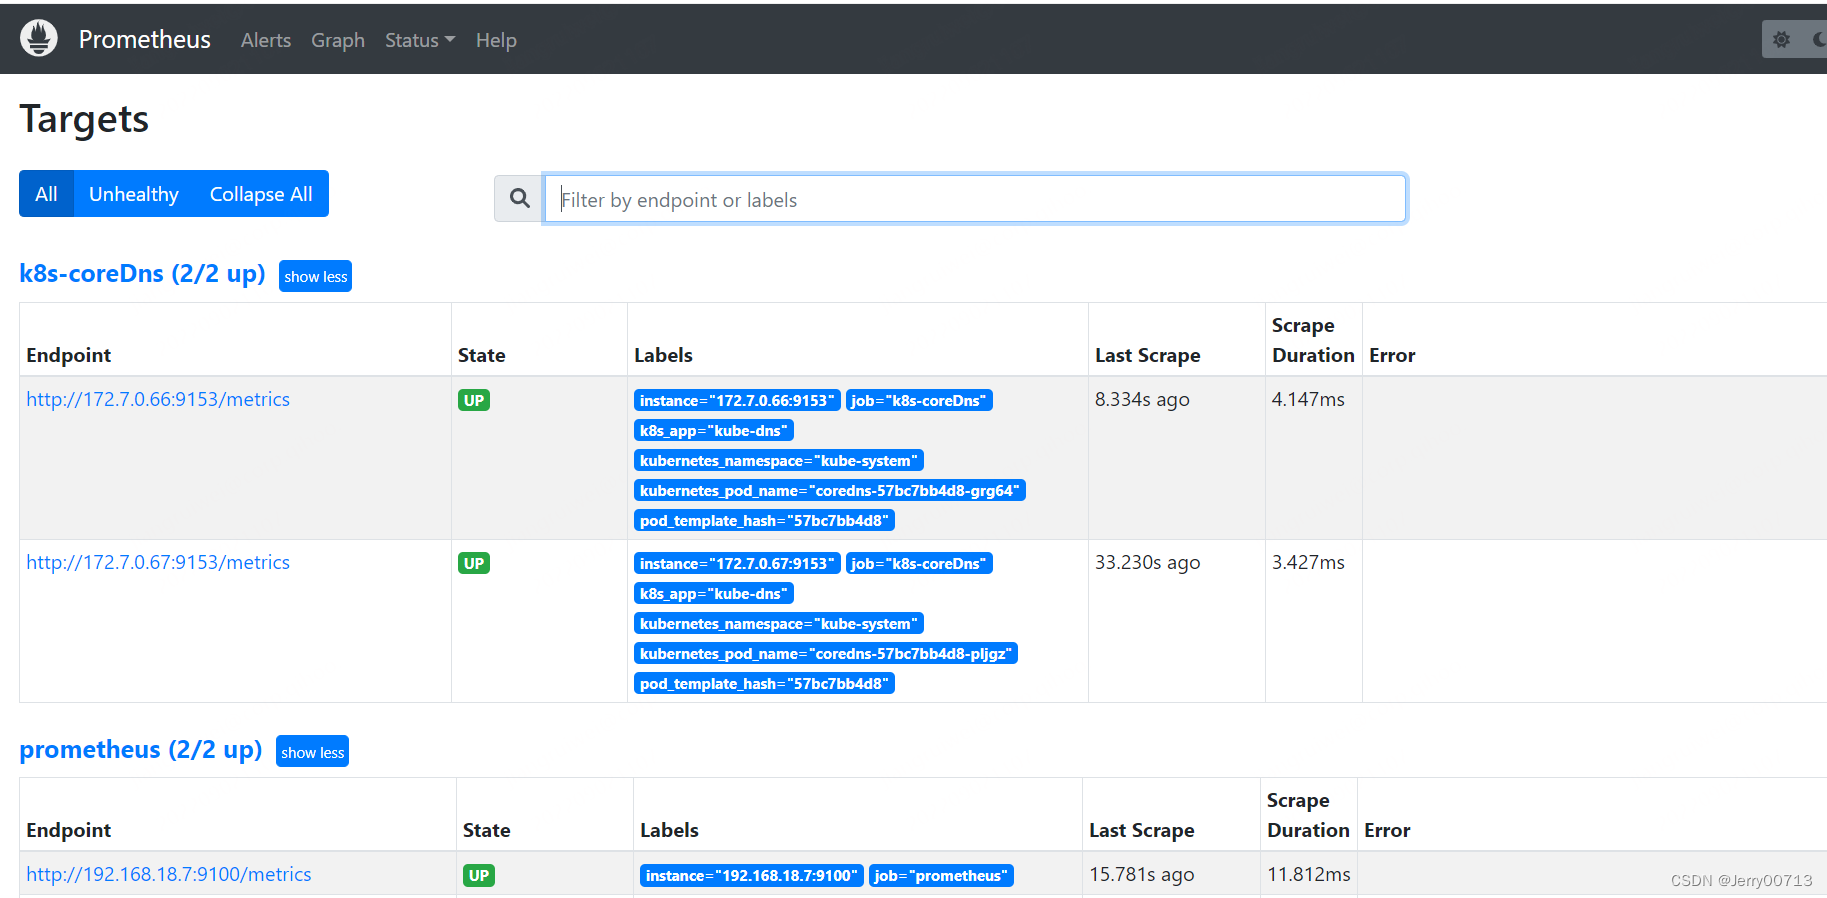
curl -X POST http://10.0.0.9:9090/-/reload浏览器访问下 prometheus http://192.168.18.9:9090/targets


配置一个node_exporter自动启动,提权
[root@VM-0-13-centos ~]# cat /etc/systemd/system/node-exporter.service
[Unit]
Description=Prometheus Node Exporter
After=network.target

[Service]
ExecStart=/opt/node_exporter/node_exporter

[Install]
WantedBy=multi-user.target
提权
chmod 777 /etc/systemd/system/node-exporter.service
启动
systemctl start node-exporter.service
systemctl enable node-exporter.service
三、集群外Prometheus 集群 k8s
1、创建RBAC
创建用于 Prometheus 访问 Kubernetes 资源对象的 RBAC 对象,使用serviceaccounts 、集群角色、集群角色绑定。简单理解:集群角色里面带有能访问集群中的那些资源,命名空间、pod资源等等。serviceaccounts 服务账号就是我们使用的账号。集群角色绑定就是将服务账号、集群角色进行绑定,意思是我们拿服务账号由于跟集群角色进行绑定,才有了集群角色的权限。如下cluster-admin是k8s的超级管理员的权限,为了方便本测试直接使用cluster-admin
1.创建 serviceaccounts,建议将 serviceaccounts 创建在专门收集监控信息(node-exporters、cadvisor、blackbox-exporter等这些kube-state的pod下的命名空间,具体在那个空间下,对集群外的监控影响不大),假如我的在devops
kubectl create sa  prometheus -n devops

2.创建prometheus角色并对其绑定cluster-admin
kubectl create clusterrolebinding prometheus --clusterrole cluster-admin --serviceaccount=devops:prometheus
但建议使用如下,自己创建ClusterRole集群角色,因为 cluster-admin 权限太大了,不安全
vim prom.rbac.yaml
apiVersion: v1
kind: ServiceAccount
metadata:
  name: prometheus
  namespace: devops   #填写对应的namespace
---
apiVersion: rbac.authorization.k8s.io/v1
kind: ClusterRole
metadata:
  name: prometheus
rules:
- apiGroups:
  - ""
  resources:
  - nodes
  - services
  - endpoints
  - pods
  - nodes/proxy
  verbs:
  - get
  - list
  - watch
- apiGroups:
  - "extensions"
  resources:
    - ingresses
  verbs:
  - get
  - list
  - watch
- apiGroups:
  - ""
  resources:
  - configmaps
  - nodes/metrics
  verbs:
  - get
- nonResourceURLs:
  - /metrics
  verbs:
  - get
---
apiVersion: rbac.authorization.k8s.io/v1beta1
kind: ClusterRoleBinding
metadata:
  name: prometheus
roleRef:
  apiGroup: rbac.authorization.k8s.io
  kind: ClusterRole
  name: prometheus
subjects:
- kind: ServiceAccount
  name: prometheus
  namespace: devops  #填写对应的namespace
kubectl apply -f prom.rbac.yaml2、获取serviceaccounts 的token
k8s 认证授权目前只要有两种,ca认证、serviceaccounts认证,ca认证一般用于创建集群的时候,另一种就是已经可以访问集群,通过集群创建serviceaccounts认证,需要使用serviceaccounts的token
#获取上面的 Prometheus 对应的 Secret 的信息:
kubectl get sa prometheus -n devops -o yaml
kubectl describe secret prometheus-token-m8lbb -n devops
3、配置Prometheus与RBAC
实验:本地实验是使用 kubeadm 部署的v1.16.2

其中 kubeadm 有些资源直接给我们提供了metrices 接口,ok我们这次实验就要获取它

3.1、保存token文件(192.168.18.9)
mkdikr /opt/prometheus/k8s
cd /opt/prometheus/k8s
vim promethues-rbac-token.yaml
3.2、配置采集任务
[root@18_9 prometheus]# cat /opt/prometheus/prometheus.yml
alerting:
  alertmanagers:
    - static_configs:
        - targets:
scrape_configs:
  - job_name: "prometheus"
    static_configs:
      - targets: ["localhost:9090","192.168.18.7:9100"]
  - job_name: k8s-coreDns
    honor_timestamps: true
    metrics_path: /metrics
    scheme: http
    kubernetes_sd_configs:
    - api_server: https://192.168.18.7:6443
      role: pod
      bearer_token_file: k8s/promethues-rbac-token.yaml
      tls_config:
        insecure_skip_verify: true
    bearer_token_file: k8s/promethues-rbac-token.yaml
    tls_config:
      insecure_skip_verify: true
    relabel_configs:
    - source_labels: [__meta_kubernetes_pod_annotation_prometheus_io_scheme]
      separator: ;
      regex: coreDns
      replacement: $1
      action: keep
    - source_labels: [__meta_kubernetes_pod_annotation_prometheus_io_path]
      separator: ;
      regex: (.+)
      target_label: __metrics_path__
      replacement: $1
      action: replace
    - source_labels: [__address__, __meta_kubernetes_pod_annotation_prometheus_io_port]
      separator: ;
      regex: ([^:]+)(?::\d+)?;(\d+)
      target_label: __address__
      replacement: $1:$2
      action: replace
    - separator: ;
      regex: __meta_kubernetes_pod_label_(.+)
      replacement: $1
      action: labelmap
    - source_labels: [__meta_kubernetes_namespace]
      separator: ;
      regex: (.*)
      target_label: kubernetes_namespace
      replacement: $1
      action: replace
    - source_labels: [__meta_kubernetes_pod_name]
      separator: ;
      regex: (.*)
      target_label: kubernetes_pod_name
      replacement: $1
      action: replace
[root@18_9 prometheus]#
讲解:
1、如果打开默认的prometheus.yaml,会发现几乎都注释,只有alerting和scrape_configs模块由内容

----------------------------------------------------------------------------------------
2、其中alerting模块针对的是报警机制
alerting:
  alertmanagers:
    - static_configs:
        - targets:

----------------------------------------------------------------------------------------
3、其中scrape_configs模块针对的是如何获取监控机制
scrape_configs:
  - job_name: "prometheus"   #其中一个job_name代表一个监控项目
    static_configs:
      - targets: ["localhost:9090","192.168.18.7:9100"]   很明显,直接看监控本机的localhost:9090,这个是自身监控,192.168.18.7:9100我们刚刚配置的监控


  - job_name: k8s-coreDns    # 其中一个job_name代表一个监控项目
    honor_timestamps: true
    metrics_path: /metrics   # 代表监控的路径
    scheme: http             # 代表监控的协议,如上的信息,代表监控http://IP/metrics
    kubernetes_sd_configs:   # 此项目重点,代表自动发现,你要知道prometheus是跟kubernetes都是google的产品,对自己产品做了支持,自动发现
    - api_server: https://192.168.18.7:6443   # 从那接入kubernetes,如果在容器中部署prometheus都不用写
      role: pod # 监控的类型是pod,这也是prometheus写好的,可以监控pod|node 等
      bearer_token_file: k8s/promethues-rbac-token.yaml  # 重点,使用的rbac
      tls_config:   # 是不是用tls协议
        insecure_skip_verify: true
    bearer_token_file: k8s/promethues-rbac-token.yaml  # 使用的rbac
    tls_config:  # 是不是用tls协议
      insecure_skip_verify: true
    relabel_configs:  # 重点如何匹配需要的pod,先看 action: keep
    - source_labels: [__meta_kubernetes_pod_annotation_prometheus_io_scheme]  # 这里面说了,我要匹配pod的注释annotation,带有prometheus_io_scheme的注释
      separator: ;
      regex: coreDns  # 而且prometheus_io_scheme=coreDns
      replacement: $1
      action: keep
    - source_labels: [__meta_kubernetes_pod_annotation_prometheus_io_path]   # 这里面说了,我要匹配pod的注释annotation,带有prometheus_io_path的注释
      separator: ;
      regex: (.+)  # 而且prometheus_io_path=$1,$1取的就是上面的metrics_path: /metrics,也就是prometheus_io_path=/metrics
      target_label: __metrics_path__
      replacement: $1
      action: replace
    - source_labels: [__address__, __meta_kubernetes_pod_annotation_prometheus_io_port]    # 这里面说了,我要匹配pod的注释annotation,带有prometheus_io_port的注释
      separator: ;
      regex: ([^:]+)(?::\d+)?;(\d+)
      target_label: __address__
      replacement: $1:$2
      action: replace
    - separator: ;
      regex: __meta_kubernetes_pod_label_(.+)
      replacement: $1
      action: labelmap
    - source_labels: [__meta_kubernetes_namespace]
      separator: ;
      regex: (.*)
      target_label: kubernetes_namespace
      replacement: $1
      action: replace
    - source_labels: [__meta_kubernetes_pod_name]
      separator: ;
      regex: (.*)
      target_label: kubernetes_pod_name
      replacement: $1
      action: replace
[root@18_9 prometheus]#
总上所述,匹配的是带有
      annotations:
       "prometheus_io_path": "/metrics"
       "prometheus_io_port": "9153"
       "prometheus_io_scheme": "coreDns"
3.2、改造coreDns,增加注释,注意annotations 跟 label 同级
kubectl edit deploy coredns -n kube-system # 注意加上" ",否则报错

kubectl get deploy coredns -n kube-system -oyaml

3.3、查看http://192.168.18.9:9090/targets
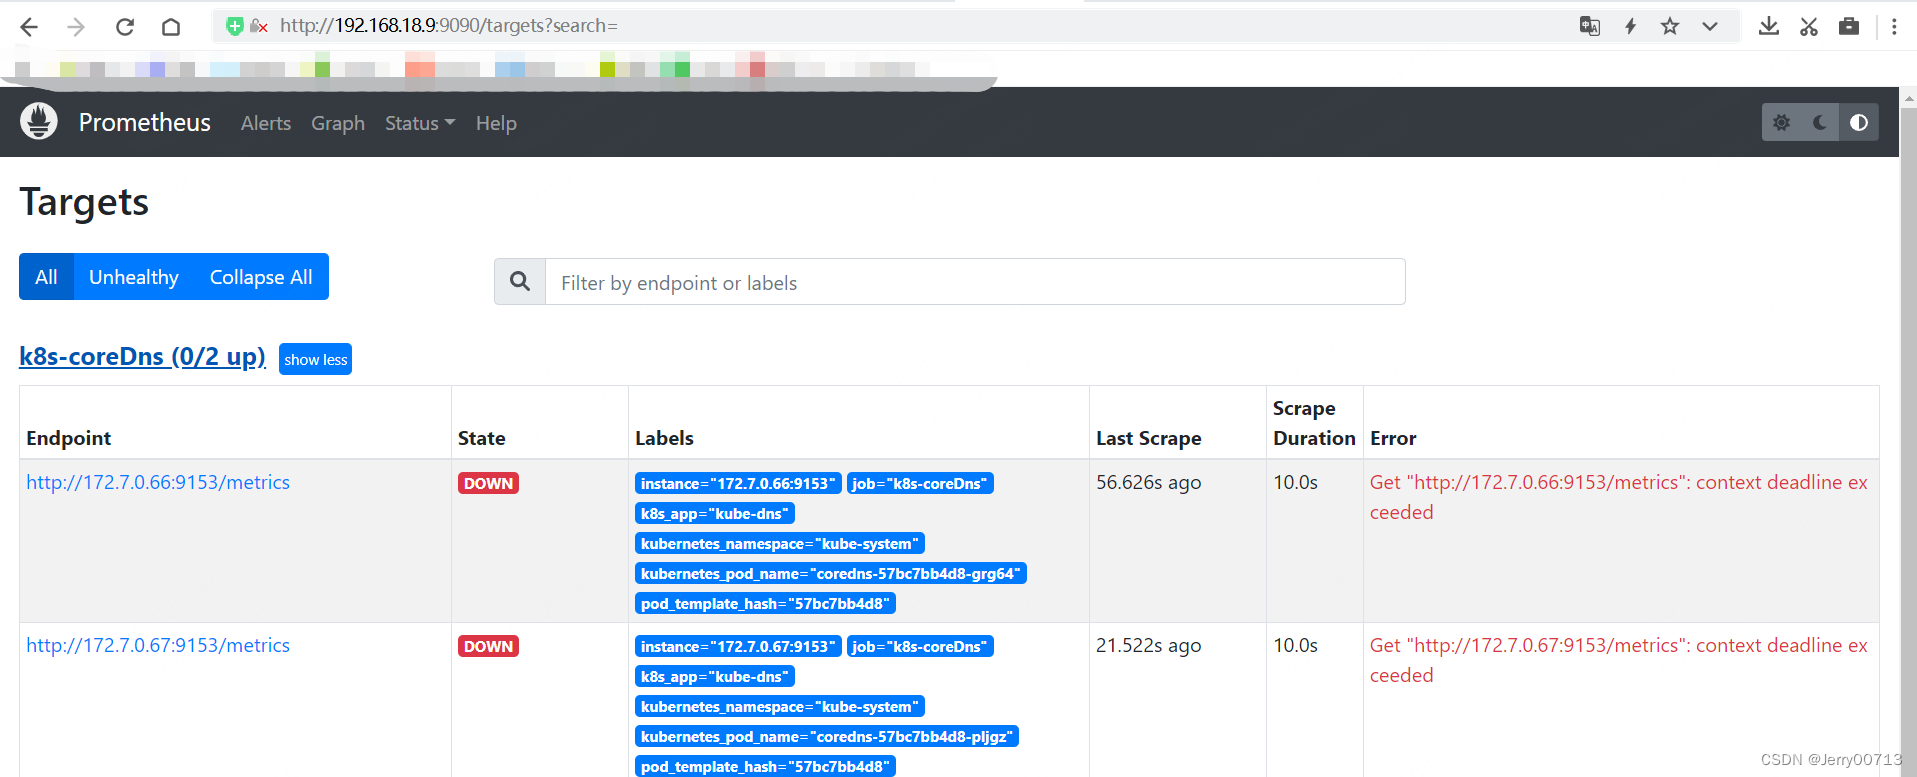
这时候发现,prometheus已经通过api接口自动发现了pod,但是是down,原因是Get "http://172.7.0.66:9153/metrics": context deadline exceeded,意思即使本机没法访问集群中的pod
![]()
所以建议在此机器部署为node节点,或者了解 CNI 插件原理,比如我的机器192.168.18.9
192.168.18.7 就是同网段的,所以去往172.7.0.66 172.7.0.67 的流量可以直接写route

查看http://192.168.18.9:9090/targets