python 时间序列预测——SimpleRNN
数据集
COE 参见 python 时间序列预测——简单神经网络
归一化预处理
from sklearn import preprocessing
import pandas as pd

loc= "COE.csv "
temp = pd.read_csv ( loc )
data= temp . drop ( temp . columns [ [ 0 , 1 ] ] , axis=1)

x=data.drop ( data . columns [ [ 0 , 4 ] ] , axis =1)
x=x.apply(np.log )
x=pd.concat ( [ x , data ['Open?' ] ] , axis=1)

scaler_x = preprocessing . MinMaxScaler (feature_range=(0 , 1) )
x = np .array ( x ) . reshape ( ( len ( x ) ,4 ) )
x = scaler_x . fit_transform ( x )

y=data ['COE$']
scaler_y = preprocessing . MinMaxScaler (feature_range=(0 , 1) )
y = np . array ( y ) . reshape ( ( len ( y ) , 1) )
y = np . log ( y )
y = scaler_y . fit_transform ( y )
拆分训练集、测试集
end=len ( x )
learn_end = int ( end * 0.95 )
x_train=x [ 0:learn_end -1 ,]
x_test=x [ learn_end : end-1 ,]
y_train=y [ 1 : learn_end ]
y_test=y [ learn_end+1: end ]
x_train=x_train.reshape ( x_train . shape + ( 1 , ) )
x_test=x_test.reshape ( x_test . shape + ( 1 , ) )

print(" Shape o f x_train is " , x_train . shape)  # (250, 4, 1)
print(" Shape o f x_test is " , y_train . shape)  # (250, 1)
SimpleRNN 训练
import numpy as np
from keras.models import Sequential
from keras.layers.recurrent import SimpleRNN
from keras.layers.core import Dense, Activation
from keras.optimizers import SGD
seed =2018
np.random.seed ( seed )
model = Sequential ()
model.add( SimpleRNN ( units =8, activation ="tanh", input_shape =(4 , 1)))
model.add( Dense ( units =1, activation ='linear'))
sgd = SGD (lr =0.0001 , momentum =0.95 ,nesterov = True )
model.compile ( loss ='mean_squared_error',optimizer = sgd )
model.fit( x_train , y_train , batch_size =10 ,epochs =100)
score_train = model.evaluate( x_train ,y_train ,batch_size =10)
score_test = model.evaluate(x_test ,y_test ,batch_size =10)
print("in train MSE = ", round( score_train,6))
print("in test MSE = ", round( score_test ,6))
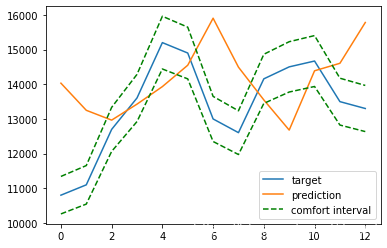
pred0 = model . predict ( x_test )
pred = np.exp(scaler_y.inverse_transform(np. array( pred0 ).reshape((len( pred0 ), 1))))
target = np.exp(scaler_y.inverse_transform(np. array(y_test).reshape((len( y_test ), 1))))
plt.plot(target)
plt.plot(pred)
plt.plot(target*1.05,'--g',target*0.95,'--g')
plt.legend(['target','prediction','comfort interval'])