(6)【Python/机器学习/深度学习】Machine-Learning模型与算法应用—使用Adaboost建模及工作环境下的数据分析整理
目录
一、为什么要使用Adaboost建模?
二、泰坦尼克号分析(工作环境)
(插曲)Python可以引入任何图形及图形可视化工具
三、数据分析
四、模型建立
1、RandomForestRegressor预测年龄
2、LogisticRegression建模
引入GridSearchCV
引入RandomizedSearchCV
3、Decision Tree建模
4、RandomForest建模
Feature Importance
5、AdaBoost建模
6、Gradient Boosting梯度提升建模
7、Support Vector Machine建模
8、Xgboost建模
9、Bagging Classifier建模
10、Extra Trees Classifier建模
11、K-Nearest Neighbor classifier(KNN)建模 using GridSearchCV
12、K-Nearest Neighbor classifier(KNN)建模 Using RandomizedSearchCV
13、Gaussian Naive Bayes建模
14、Gaussian Naive Bayes建模 with Gaussian Process Classifier
15、VotingClassifier建模
一、为什么要使用Adaboost建模?
Adaboost,英文全称"Adaptive Boosting",意为自适应增强,是一种基于Boosting集成学习的算法。Boosting是一种试图从多个弱分类器中创建一个强分类器的集合技术。Adaboost的核心思想是通过从训练数据构建模型,然后创建第二个模型来尝试修正第一个模型的错误。
Adaboost算法最初由Yoav Freund和Robert Schapire在1995年提出。该算法的主要目标是通过反复学习不断改变训练样本的权重和弱分类器的权值,最终筛选出权值系数最小的弱分类器组合成一个最终强分类器。
Adaboost,全称为Adaptive Boosting,是一种有效且实用的Boosting算法。它的核心思想是以一种高度自适应的方式按顺序训练弱学习器,针对分类问题,根据前一次的分类效果调整数据的权重。
具体来说,Adaboost算法可以简述为以下三个步骤:
1. 初始化训练数据的权值分布。假设有N个训练样本数据,每一个训练样本最开始时,都被赋予相同的权值:w1=1/N。
2. 训练弱分类器hi。在训练过程中,如果某个训练样本点被弱分类器hi准确地分类,那么在构造下一个训练集中,它对应的权值要减小;相反,如果某个训练样本点被错误分类,那么它的权值就应该增大。权值更新过的样本集被用于训练下一个分类器,整个训练过程如此迭代地进行下去。
3. 将各个训练得到的弱分类器组合成一个强分类器。各个弱分类器的训练过程结束后,加大分类误差率小的弱分类器的权重,使其在最终的分类函数中起着较大的决定作用,而降低分类误差率大的弱分类器的权重,使其在最终的分类函数中起着较小的决定作用。此外,Adaboost也是一种加法模型的学习算法,其损失函数为指数函数。通过不断重复调整权重和训练弱学习器,直到误分类数低于预设值或迭代次数达到指定最大值,最终得到一个强学习器。值得一提的是,Adaboost具有很高的精度,并且充分考虑了每个分类器的权重。但是,Adaboost迭代次数也就是弱分类器数目不太好设定,可以使用交叉验证来进行确定。
adaboost与random forest的区别
Adaboost和Random Forest都是集成学习的算法,然而它们在许多方面存在显著的差异。首先,Adaboost是一种基于Boosting的加法模型学习算法,它反复进行学习,不断调整训练样本的权重和弱分类器的权值,最终选取权值系数最小的弱分类器组合成一个强分类器。其常用的弱学习器是决策树和神经网络。
另一方面,随机森林也是一种集成学习的算法,但它属于Bagging流派。随机森林通过建立并结合多个决策树的输出来得到一个最终结果,这旨在提高预测的准确性。不同于Adaboost一次只使用一个弱分类器,随机森林允许同时使用所有的决策树,并且每棵树的建立都考虑了样本随机性和特征随机性,这样可以减少过拟合的风险。
总结来说,虽然Adaboost和Random Forest都是集成学习的算法,但它们在建模方法、基学习器的选择等方面存在明显的区别。
Boosting与Bagging流派区别
Bagging和Boosting都是将已有的分类或回归算法通过一定方式组合起来,形成一个性能更加强大的分类器。虽然二者都是集成学习的方法,但是存在一些显著的差异。
Bagging,也称为套袋法,其算法过程如下:从原始样本集中抽取训练集。每轮从原始样本集中使用Bootstraping的方法抽取n个训练样本(在训练集中,有些样本可能被多次抽取到,而有些样本可能一次都没有被抽中)。共进行k轮抽取,得到k个训练集。(k个训练集之间是相互独立的) 每次使用一个训练集得到一个模型,k个训练集共得到k个模型。对分类问题:将上步得到的k个模型采用投票的方式得到分类结果;对回归问题,计算上述模型的均值作为最后的结果。(所有模型的重要性相同)。
而Boosting的主要思想是将弱分类器组装成一个强分类器。在PAC(概率近似正确)学习框架下,则一定可以将弱分类器组装成一个强分类器。关于Boosting有两个核心问题: 1. 在每一轮如何改变训练数据的权值或概率分布?通过提高那些在前一轮被弱分类器分错样例的权值,减小前一轮分对样例的权值,来使得分类器重点关注那些被误分的数据,直至所有的样本都被正确分类。2. 通过什么方式来组合弱分类器?通过加法模型将弱分类器进行线性组合,比如AdaBoost通过加权多数表决的方式,即增大错误率小的分类器的权值,同时减小错误率较大的分类器的权值。
从以上描述可以看出,Bagging和Boosting两个流派的区别主要体现在以下几个方面:样本选择、样例权重、预测函数、并行计算以及思路。

为了更好的在编译器中显示图片需要安装python第三方库:
pip install ipython
# pip install ipythonfrom IPython.display import Image
#Image(filename='D:/python/Project0-Python-MachineLearning/adaboost.jpg')
Adaboost算法图解
二、泰坦尼克号分析(工作环境)
import pandas as pd
import numpy as np
from matplotlib import pyplot as plt
import seaborn as sns
%matplotlib inline import warnings ## importing warnings library.
warnings.filterwarnings('ignore') ## Ignore warningimport os ## imporing os
print(os.listdir("./"))
## Importing Titanic datasets from www.kaggle.com
train = pd.read_csv("./titanic_train.csv")
test = pd.read_csv("./titanic_test.csv")
#./seaborn-data/raw/titanic
#train = pd.read_csv("./titanic/titanic_train.csv")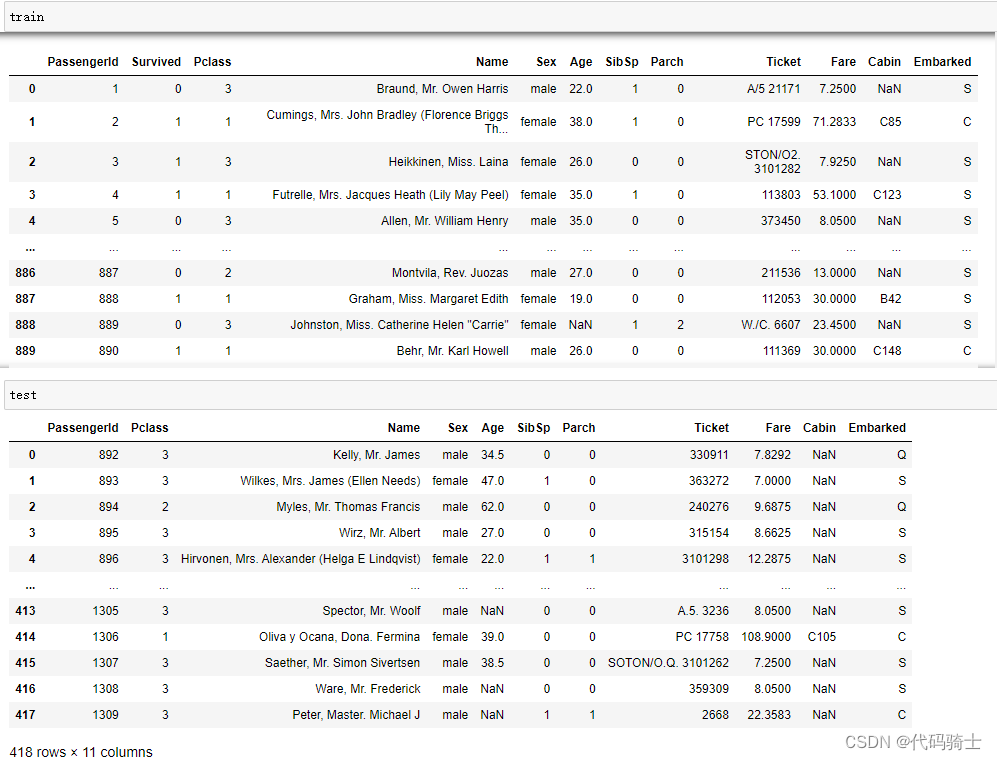
(插曲)Python可以引入任何图形及图形可视化工具
#导入一个HTML数据分析网页
%%HTML
<div class='tableauPlaceholder' id='viz1516349898238' style='position: relative'><noscript><a href='#'><img alt='An Overview of Titanic Training Dataset ' src='https://public.tableau.com/static/images/Ti/Titanic_data_mining/Dashboard1/1_rss.png' style='border: none' /></a></noscript><object class='tableauViz' style='display:none;'><param name='host_url' value='https%3A%2F%2Fpublic.tableau.com%2F' /> <param name='embed_code_version' value='3' /> <param name='site_root' value='' /><param name='name' value='Titanic_data_mining/Dashboard1' /><param name='tabs' value='no' /><param name='toolbar' value='yes' /><param name='static_image' value='https://public.tableau.com/static/images/Ti/Titanic_data_mining/Dashboard1/1.png' /> <param name='animate_transition' value='yes' /><param name='display_static_image' value='yes' /><param name='display_spinner' value='yes' /><param name='display_overlay' value='yes' /><param name='display_count' value='yes' /><param name='filter' value='publish=yes' /></object></div> <script type='text/javascript'> var divElement = document.getElementById('viz1516349898238'); var vizElement = divElement.getElementsByTagName('object')[0]; vizElement.style.width='100%';vizElement.style.height=(divElement.offsetWidth*0.75)+'px'; var scriptElement = document.createElement('script'); scriptElement.src = 'https://public.tableau.com/javascripts/api/viz_v1.js'; vizElement.parentNode.insertBefore(scriptElement, vizElement); </script>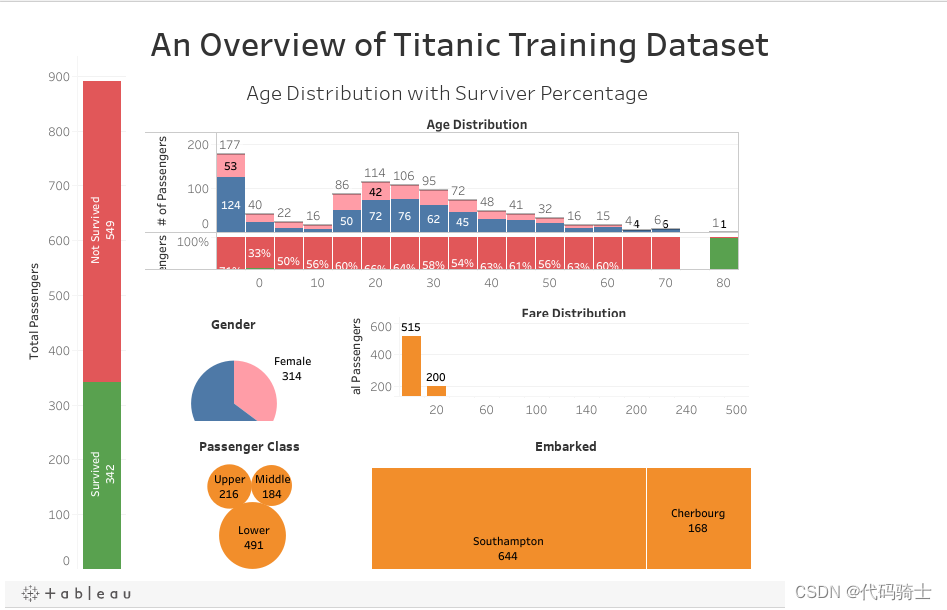
三、数据分析
passengerid = test.PassengerIdprint (train.info())
print ("*"*80)
print (test.info())
<class 'pandas.core.frame.DataFrame'> RangeIndex: 891 entries, 0 to 890 Data columns (total 12 columns):# Column Non-Null Count Dtype --- ------ -------------- ----- 0 PassengerId 891 non-null int64 1 Survived 891 non-null int64 2 Pclass 891 non-null int64 3 Name 891 non-null object 4 Sex 891 non-null object 5 Age 714 non-null float646 SibSp 891 non-null int64 7 Parch 891 non-null int64 8 Ticket 891 non-null object 9 Fare 891 non-null float6410 Cabin 204 non-null object 11 Embarked 889 non-null object dtypes: float64(2), int64(5), object(5) memory usage: 83.7+ KB None ******************************************************************************** <class 'pandas.core.frame.DataFrame'> RangeIndex: 418 entries, 0 to 417 Data columns (total 11 columns):# Column Non-Null Count Dtype --- ------ -------------- ----- 0 PassengerId 418 non-null int64 1 Pclass 418 non-null int64 2 Name 418 non-null object 3 Sex 418 non-null object 4 Age 332 non-null float645 SibSp 418 non-null int64 6 Parch 418 non-null int64 7 Ticket 418 non-null object 8 Fare 417 non-null float649 Cabin 91 non-null object 10 Embarked 418 non-null object dtypes: float64(2), int64(4), object(5) memory usage: 36.0+ KB None
写个小程序统计缺失值
# total percentage of the missing values
# 统计缺失值
def missing_percentage(df):"""This function takes a DataFrame(df) as input and returns two columns, total missing values and total missing values percentage"""total = df.isnull().sum().sort_values(ascending = False)percent = round(df.isnull().sum().sort_values(ascending = False)/len(df)*100,2)return pd.concat([total, percent], axis=1, keys=['Total','Percent'])
missing_percentage(train)
missing_percentage(test)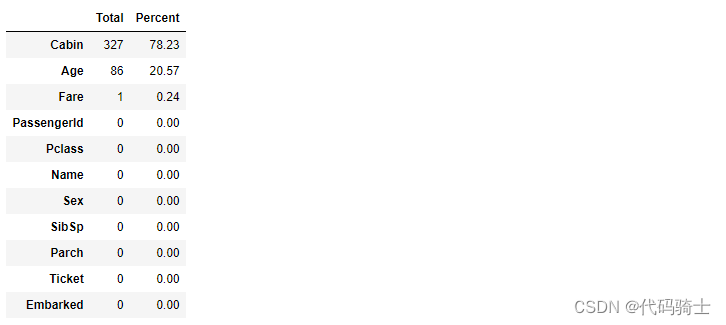
def percent_value_counts(df, feature):percent = pd.DataFrame(round(df.loc[:,feature].value_counts(dropna=False, normalize=True)*100,2))## creating a df with thtotal = pd.DataFrame(df.loc[:,feature].value_counts(dropna=False))## concating percent and total dataframetotal.columns = ["Total"]percent.columns = ['Percent']return pd.concat([total, percent], axis = 1)percent_value_counts(train, 'Embarked')
train[train.Embarked.isnull()]
sns.set_style('darkgrid')
fig, ax = plt.subplots(figsize=(16,12),ncols=2)
ax1 = sns.boxplot(x="Embarked", y="Fare", hue="Pclass", data=train, ax = ax[0]);
ax2 = sns.boxplot(x="Embarked", y="Fare", hue="Pclass", data=test, ax = ax[1]);
ax1.set_title("Training Set", fontsize = 18)
ax2.set_title('Test Set',  fontsize = 18)## Fixing legends
leg_1 = ax1.get_legend()
leg_1.set_title("PClass")
legs = leg_1.texts
legs[0].set_text('Upper')
legs[1].set_text('Middle')
legs[2].set_text('Lower')fig.show()
Here, in both training set and test set, the average fare closest to $80 are in the C Embarked values where pclass is 1. So, let's fill in the missing values as "C"
在这里,训练集和测试集中平均票价最接近80美元的乘客登船地点(C Embarked)值都是pclass为1。因此,让我们将缺失值填充为“C”
## Replacing the null values in the Embarked column with the mode.
train.Embarked.fillna("C", inplace=True)
print("Train Cabin missing: " + str(train.Cabin.isnull().sum()/len(train.Cabin)))
print("Test Cabin missing: " + str(test.Cabin.isnull().sum()/len(test.Cabin)))Train Cabin missing: 0.7710437710437711 Test Cabin missing: 0.7822966507177034
## Concat train and test into a variable "all_data"
survivers = train.Survivedtrain.drop(["Survived"],axis=1, inplace=True)all_data = pd.concat([train,test], ignore_index=False)## Assign all the null values to N
all_data.Cabin.fillna("N", inplace=True)
all_data.Cabin = [i[0] for i in all_data.Cabin]percent_value_counts(all_data, "Cabin")
all_data.groupby("Cabin")['Fare'].mean().sort_values()
def cabin_estimator(i):"""Grouping cabin feature by the first letter"""a = 0if i<16:a = "G"elif i>=16 and i<27:a = "F"elif i>=27 and i<38:a = "T"elif i>=38 and i<47:a = "A"elif i>= 47 and i<53:a = "E"elif i>= 53 and i<54:a = "D"elif i>=54 and i<116:a = 'C'else:a = "B"return awith_N = all_data[all_data.Cabin == "N"]without_N = all_data[all_data.Cabin != "N"]##applying cabin estimator function.
with_N['Cabin'] = with_N.Fare.apply(lambda x: cabin_estimator(x))## getting back train.
all_data = pd.concat([with_N, without_N], axis=0)## PassengerId helps us separate train and test.
all_data.sort_values(by = 'PassengerId', inplace=True)## Separating train and test from all_data.
train = all_data[:891]test = all_data[891:]# adding saved target variable with train.
train['Survived'] = survivers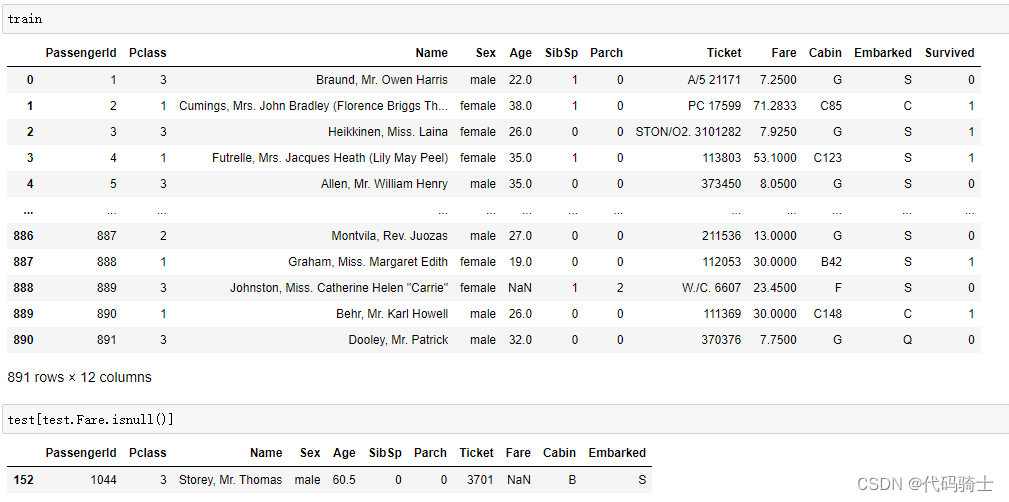
missing_value = test[(test.Pclass == 3) & (test.Embarked == "S") & (test.Sex == "male")].Fare.mean()
## replace the test.fare null values with test.fare mean
test.Fare.fillna(missing_value, inplace=True)missing_value12.718872
test[test.Fare.isnull()]Passenger Id Pclass Name Sex Age SibSpParch Ticket Fare Cabin Embarked
print ("Train age missing value: " + str((train.Age.isnull().sum()/len(train))*100)+str("%"))
print ("Test age missing value: " + str((test.Age.isnull().sum()/len(test))*100)+str("%"))
Train age missing value: 19.865319865319865% Test age missing value: 20.574162679425836%
import seaborn as sns
pal = {'male':"green", 'female':"Pink"}
sns.set(style="darkgrid")
plt.subplots(figsize = (15,8))
ax = sns.barplot(x = "Sex", y = "Survived", data=train, palette = pal,linewidth=5,order = ['female','male'],capsize = .05,)plt.title("Survived/Non-Survived Passenger Gender Distribution", fontsize = 25,loc = 'center', pad = 40)
plt.ylabel("% of passenger survived", fontsize = 15, )
plt.xlabel("Sex",fontsize = 15);