Gafana Redis Overview dashboard
1. 简介
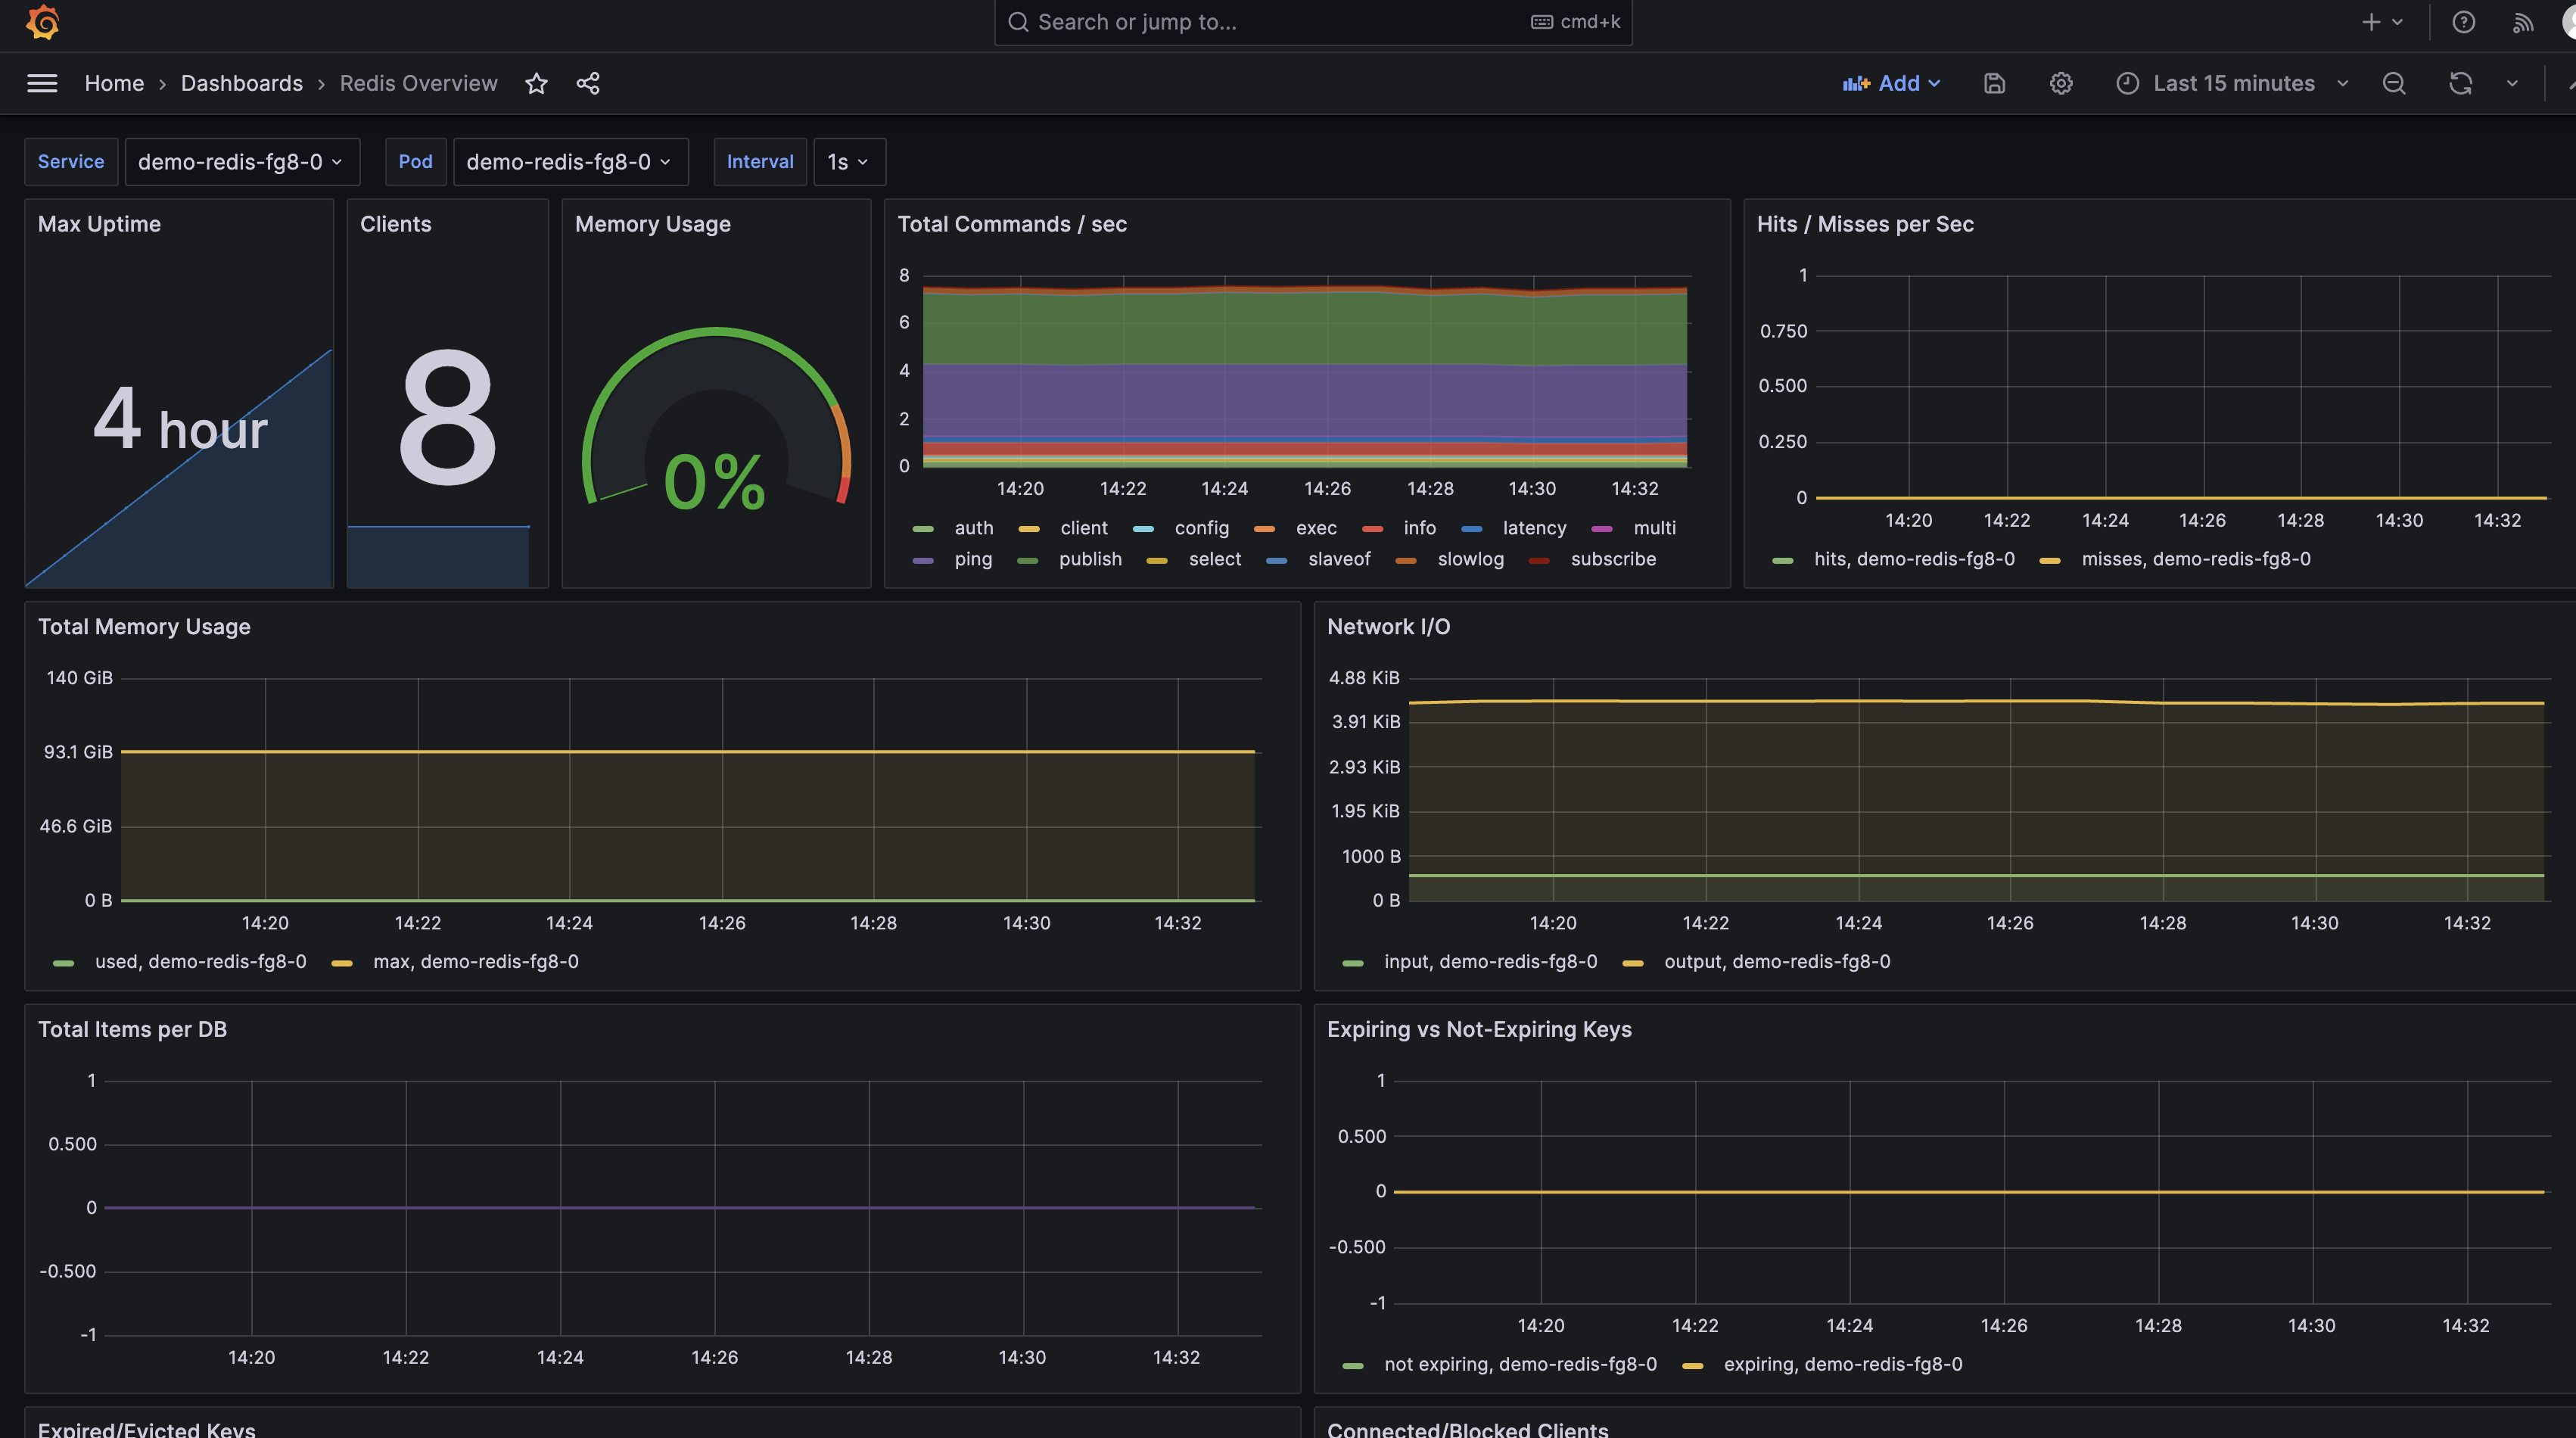
根据提供的 Redis 监控仪表盘 JSON 文件,包含的监控指标及其简要描述如下:
redis_uptime_in_seconds: Redis 实例的运行时间(秒)。
redis_connected_clients: 当前连接到 Redis 实例的客户端数量。
redis_memory_used_bytes: Redis 实例使用的内存量(字节)。
redis_memory_max_bytes: Redis 实例可使用的最大内存量(字节)。
redis_commands_total: 执行的 Redis 命令总数,按命令类型分类。
redis_keyspace_hits_total: Redis 键空间命中次数。
redis_keyspace_misses_total: Redis 键空间未命中次数。
redis_net_input_bytes_total: Redis 实例的网络入站流量(字节)。
redis_net_output_bytes_total: Redis 实例的网络出站流量(字节)。
redis_db_keys: 每个 Redis 数据库中的键总数。
redis_db_keys_expiring: 每个 Redis 数据库中将要过期的键数量。
redis_expired_keys_total: 过期的键总数。
redis_evicted_keys_total: 被驱逐的键总数。
redis_blocked_clients: 被阻塞的客户端数量。
redis_commands_duration_seconds_total: 按命令类型分类的 Redis 命令执行时间总计(秒)。
这些指标涵盖了 Redis 实例的运行时间、客户端连接数、内存使用情况、命令执行情况、键空间状态、网络流量等多个方面,可以全面反映实例的运行状况。
2. 效果
数据源:proemetheus
3. 内容
redis.json
{"annotations": {"list": [{"builtIn": 1,"datasource": "-- Grafana --","enable": true,"hide": true,"iconColor": "rgba(0, 211, 255, 1)","name": "Annotations & Alerts","type": "dashboard"}]},"description": "Redis Overview","editable": true,"gnetId": 763,"graphTooltip": 1,"id": 28,"iteration": 1620627698368,"links": [],"panels": [{"cacheTimeout": null,"colorBackground": false,"colorValue": false,"colors": ["rgba(245, 54, 54, 0.9)","rgba(237, 129, 40, 0.89)","rgba(50, 172, 45, 0.97)"],"datasource": "Prometheus","decimals": 0,"editable": true,"error": false,"fieldConfig": {"defaults": {"custom": {}},"overrides": []},"format": "s","gauge": {"maxValue": 100,"minValue": 0,"show": false,"thresholdLabels": false,"thresholdMarkers": true},"gridPos": {"h": 7,"w": 3,"x": 0,"y": 0},"id": 9,"interval": null,"isNew": true,"links": [],"mappingType": 1,"mappingTypes": [{"name": "value to text","value": 1},{"name": "range to text","value": 2}],"maxDataPoints": 100,"nullPointMode": "connected","nullText": null,"postfix": "","postfixFontSize": "50%","prefix": "","prefixFontSize": "50%","rangeMaps": [{"from": "null","text": "N/A","to": "null"}],"sparkline": {"fillColor": "rgba(31, 118, 189, 0.18)","full": false,"lineColor": "rgb(31, 120, 193)","show": true},"tableColumn": "","targets": [{"expr": "max(max_over_time(redis_uptime_in_seconds{service=~\"$service\",pod=~\"$pod\"}[$__interval]))","format": "time_series","interval": "","intervalFactor": 2,"legendFormat": "","metric": "","refId": "A","step": 1800}],"thresholds": "","title": "Max Uptime","type": "singlestat","valueFontSize": "70%","valueMaps": [{"op": "=","text": "N/A","value": "null"}],"valueName": "current"},{"cacheTimeout": null,"colorBackground": false,"colorValue": false,"colors": ["rgba(245, 54, 54, 0.9)","rgba(237, 129, 40, 0.89)","rgba(50, 172, 45, 0.97)"],"datasource": "Prometheus","decimals": 0,"editable": true,"error": false,"fieldConfig": {"defaults": {"custom": {}},"overrides": []},"format": "none","gauge": {"maxValue": 100,"minValue": 0,"show": false,"thresholdLabels": false,"thresholdMarkers": true},"gridPos": {"h": 7,"w": 2,"x": 3,"y": 0},"hideTimeOverride": true,"id": 12,"interval": null,"isNew": true,"links": [],"mappingType": 1,"mappingTypes": [{"name": "value to text","value": 1},{"name": "range to text","value": 2}],"maxDataPoints": 100,"nullPointMode": "connected","nullText": null,"postfix": "","postfixFontSize": "50%","prefix": "","prefixFontSize": "50%","rangeMaps": [{"from": "null","text": "N/A","to": "null"}],"sparkline": {"fillColor": "rgba(31, 118, 189, 0.18)","full": false,"lineColor": "rgb(31, 120, 193)","show": true},"tableColumn": "","targets": [{"expr": "sum(redis_connected_clients{service=~\"$service\",pod=~\"$pod\"})","format": "time_series","intervalFactor": 2,"legendFormat": "","metric": "","refId": "A","step": 2}],"thresholds": "","timeFrom": "1m","timeShift": null,"title": "Clients","type": "singlestat","valueFontSize": "80%","valueMaps": [{"op": "=","text": "N/A","value": "null"}],"valueName": "current"},{"cacheTimeout": null,"colorBackground": false,"colorValue": false,"colors": ["rgba(50, 172, 45, 0.97)","rgba(237, 129, 40, 0.89)","rgba(245, 54, 54, 0.9)"],"datasource": "Prometheus","decimals": 0,"editable": true,"error": false,"fieldConfig": {"defaults": {"custom": {}},"overrides": []},"format": "percent","gauge": {"maxValue": 100,"minValue": 0,"show": true,"thresholdLabels": false,"thresholdMarkers": true},"gridPos": {"h": 7,"w": 3,"x": 5,"y": 0},"hideTimeOverride": true,"id": 11,"interval": null,"isNew": true,"links": [],"mappingType": 1,"mappingTypes": [{"name": "value to text","value": 1},{"name": "range to text","value": 2}],"maxDataPoints": 100,"nullPointMode": "connected","nullText": null,"postfix": "","postfixFontSize": "50%","prefix": "","prefixFontSize": "50%","rangeMaps": [{"from": "null","text": "N/A","to": "null"}],"sparkline": {"fillColor": "rgba(31, 118, 189, 0.18)","full": false,"lineColor": "rgb(31, 120, 193)","show": true},"tableColumn": "","targets": [{"expr": "sum(100 * (redis_memory_used_bytes{service=~\"$service\",pod=~\"$pod\"}  / redis_memory_max_bytes{service=~\"$service\",pod=~\"$pod\"}))","format": "time_series","interval": "","intervalFactor": 2,"legendFormat": "","metric": "","refId": "A","step": 2}],"thresholds": "80,95","timeFrom": "1m","timeShift": null,"title": "Memory Usage","type": "singlestat","valueFontSize": "80%","valueMaps": [{"op": "=","text": "N/A","value": "null"}],"valueName": "current"},{"aliasColors": {},"bars": false,"dashLength": 10,"dashes": false,"datasource": "Prometheus","editable": true,"error": false,"fieldConfig": {"defaults": {"custom": {},"links": []},"overrides": []},"fill": 8,"fillGradient": 0,"grid": {},"gridPos": {"h": 7,"w": 8,"x": 8,"y": 0},"hiddenSeries": false,"id": 18,"isNew": true,"legend": {"avg": false,"current": false,"hideEmpty": false,"hideZero": false,"max": false,"min": false,"show": true,"total": false,"values": false},"lines": true,"linewidth": 1,"links": [],"nullPointMode": "connected","options": {"alertThreshold": true},"percentage": false,"pluginVersion": "7.4.2","pointradius": 5,"points": false,"renderer": "flot","seriesOverrides": [],"spaceLength": 10,"stack": true,"steppedLine": false,"targets": [{"expr": "sum(rate(redis_commands_total{service=~\"$service\",pod=~\"$pod\"} [1m])) by (cmd)","format": "time_series","interval": "","intervalFactor": 2,"legendFormat": "{{ cmd }}","metric": "redis_command_calls_total","refId": "A","step": 240}],"thresholds": [],"timeFrom": null,"timeRegions": [],"timeShift": null,"title": "Total Commands / sec","tooltip": {"msResolution": true,"shared": true,"sort": 2,"value_type": "individual"},"type": "graph","xaxis": {"buckets": null,"mode": "time","name": null,"show": true,"values": []},"yaxes": [{"format": "short","label": null,"logBase": 1,"max": null,"min": null,"show": true},{"format": "short","label": null,"logBase": 1,"max": null,"min": null,"show": true}],"yaxis": {"align": false,"alignLevel": null}},{"aliasColors": {},"bars": false,"dashLength": 10,"dashes": false,"datasource": "Prometheus","decimals": 2,"editable": true,"error": false,"fieldConfig": {"defaults": {"custom": {},"links": []},"overrides": []},"fill": 1,"fillGradient": 0,"grid": {},"gridPos": {"h": 7,"w": 8,"x": 16,"y": 0},"hiddenSeries": false,"id": 1,"isNew": true,"legend": {"avg": false,"current": false,"max": false,"min": false,"show": true,"total": false,"values": false},"lines": true,"linewidth": 2,"links": [],"nullPointMode": "connected","options": {"alertThreshold": true},"percentage": true,"pluginVersion": "7.4.2","pointradius": 5,"points": false,"renderer": "flot","seriesOverrides": [],"spaceLength": 10,"stack": false,"steppedLine": false,"targets": [{"expr": "irate(redis_keyspace_hits_total{service=~\"$service\",pod=~\"$pod\"}[5m])","format": "time_series","hide": false,"interval": "","intervalFactor": 2,"legendFormat": "hits, {{ pod }}","metric": "","refId": "A","step": 240,"target": ""},{"expr": "irate(redis_keyspace_misses_total{service=~\"$service\",pod=~\"$pod\"}[5m])","format": "time_series","hide": false,"interval": "","intervalFactor": 2,"legendFormat": "misses, {{ pod }}","metric": "","refId": "B","step": 240,"target": ""}],"thresholds": [],"timeFrom": null,"timeRegions": [],"timeShift": null,"title": "Hits / Misses per Sec","tooltip": {"msResolution": false,"shared": true,"sort": 0,"value_type": "individual"},"type": "graph","xaxis": {"buckets": null,"mode": "time","name": null,"show": true,"values": []},"yaxes": [{"format": "short","label": "","logBase": 1,"max": null,"min": 0,"show": true},{"format": "short","label": null,"logBase": 1,"max": null,"min": null,"show": true}],"yaxis": {"align": false,"alignLevel": null}},{"aliasColors": {"max": "#BF1B00"},"bars": false,"dashLength": 10,"dashes": false,"datasource": "Prometheus","editable": true,"error": false,"fieldConfig": {"defaults": {"custom": {},"links": []},"overrides": []},"fill": 1,"fillGradient": 0,"grid": {},"gridPos": {"h": 7,"w": 12,"x": 0,"y": 7},"hiddenSeries": false,"id": 7,"isNew": true,"legend": {"avg": false,"current": false,"hideEmpty": false,"hideZero": false,"max": false,"min": false,"show": true,"total": false,"values": false},"lines": true,"linewidth": 2,"links": [],"nullPointMode": "null as zero","options": {"alertThreshold": true},"percentage": false,"pluginVersion": "7.4.2","pointradius": 5,"points": false,"renderer": "flot","seriesOverrides": [],"spaceLength": 10,"stack": false,"steppedLine": false,"targets": [{"expr": "redis_memory_used_bytes{service=~\"$service\",pod=~\"$pod\"}","format": "time_series","interval": "","intervalFactor": 2,"legendFormat": "used, {{ pod }}","metric": "","refId": "A","step": 240,"target": ""},{"expr": "redis_memory_max_bytes{service=~\"$service\",pod=~\"$pod\"}","format": "time_series","hide": false,"interval": "","intervalFactor": 2,"legendFormat": "max, {{ pod }}","refId": "B","step": 240}],"thresholds": [],"timeFrom": null,"timeRegions": [],"timeShift": null,"title": "Total Memory Usage","tooltip": {"msResolution": false,"shared": true,"sort": 0,"value_type": "cumulative"},"type": "graph","xaxis": {"buckets": null,"mode": "time","name": null,"show": true,"values": []},"yaxes": [{"format": "bytes","label": null,"logBase": 1,"max": null,"min": 0,"show": true},{"format": "short","label": null,"logBase": 1,"max": null,"min": null,"show": true}],"yaxis": {"align": false,"alignLevel": null}},{"aliasColors": {},"bars": false,"dashLength": 10,"dashes": false,"datasource": "Prometheus","editable": true,"error": false,"fieldConfig": {"defaults": {"custom": {},"links": []},"overrides": []},"fill": 1,"fillGradient": 0,"grid": {},"gridPos": {"h": 7,"w": 12,"x": 12,"y": 7},"hiddenSeries": false,"id": 10,"isNew": true,"legend": {"avg": false,"current": false,"max": false,"min": false,"show": true,"total": false,"values": false},"lines": true,"linewidth": 2,"links": [],"nullPointMode": "connected","options": {"alertThreshold": true},"percentage": false,"pluginVersion": "7.4.2","pointradius": 5,"points": false,"renderer": "flot","seriesOverrides": [],"spaceLength": 10,"stack": false,"steppedLine": false,"targets": [{"expr": "sum(rate(redis_net_input_bytes_total{service=~\"$service\",pod=~\"$pod\"}[5m])) by (pod)","format": "time_series","interval": "","intervalFactor": 2,"legendFormat": "input, {{ pod }}","refId": "A","step": 240},{"expr": "sum(rate(redis_net_output_bytes_total{service=~\"$service\",pod=~\"$pod\"}[5m])) by (pod)","format": "time_series","interval": "","intervalFactor": 2,"legendFormat": "output, {{ pod }}","refId": "B","step": 240}],"thresholds": [],"timeFrom": null,"timeRegions": [],"timeShift": null,"title": "Network I/O","tooltip": {"msResolution": true,"shared": true,"sort": 0,"value_type": "cumulative"},"type": "graph","xaxis": {"buckets": null,"mode": "time","name": null,"show": true,"values": []},"yaxes": [{"format": "bytes","label": null,"logBase": 1,"max": null,"min": null,"show": true},{"format": "short","label": null,"logBase": 1,"max": null,"min": null,"show": true}],"yaxis": {"align": false,"alignLevel": null}},{"aliasColors": {},"bars": false,"dashLength": 10,"dashes": false,"datasource": "Prometheus","editable": true,"error": false,"fieldConfig": {"defaults": {"custom": {},"links": []},"overrides": []},"fill": 7,"fillGradient": 0,"grid": {},"gridPos": {"h": 7,"w": 12,"x": 0,"y": 14},"hiddenSeries": false,"id": 5,"isNew": true,"legend": {"alignAsTable": false,"avg": false,"current": true,"hideEmpty": false,"hideZero": true,"max": false,"min": false,"rightSide": false,"show": true,"total": false,"values": true},"lines": true,"linewidth": 2,"links": [],"nullPointMode": "connected","options": {"alertThreshold": true},"percentage": false,"pluginVersion": "7.4.2","pointradius": 5,"points": false,"renderer": "flot","seriesOverrides": [],"spaceLength": 10,"stack": true,"steppedLine": false,"targets": [{"expr": "sum (redis_db_keys{service=~\"$service\",pod=~\"$pod\"}) by (db, pod)","format": "time_series","interval": "","intervalFactor": 2,"legendFormat": "{{ db }}, {{ pod }}","refId": "A","step": 240,"target": ""}],"thresholds": [],"timeFrom": null,"timeRegions": [],"timeShift": null,"title": "Total Items per DB","tooltip": {"msResolution": false,"shared": true,"sort": 0,"value_type": "individual"},"type": "graph","xaxis": {"buckets": null,"mode": "time","name": null,"show": true,"values": []},"yaxes": [{"format": "none","label": null,"logBase": 1,"max": null,"min": null,"show": true},{"format": "short","label": null,"logBase": 1,"max": null,"min": null,"show": true}],"yaxis": {"align": false,"alignLevel": null}},{"aliasColors": {},"bars": false,"dashLength": 10,"dashes": false,"datasource": "Prometheus","editable": true,"error": false,"fieldConfig": {"defaults": {"custom": {},"links": []},"overrides": []},"fill": 7,"fillGradient": 0,"grid": {},"gridPos": {"h": 7,"w": 12,"x": 12,"y": 14},"hiddenSeries": false,"id": 13,"isNew": true,"legend": {"avg": false,"current": false,"max": false,"min": false,"show": true,"total": false,"values": false},"lines": true,"linewidth": 2,"links": [],"nullPointMode": "connected","options": {"alertThreshold": true},"percentage": false,"pluginVersion": "7.4.2","pointradius": 5,"points": false,"renderer": "flot","seriesOverrides": [],"spaceLength": 10,"stack": true,"steppedLine": false,"targets": [{"expr": "sum (redis_db_keys{service=~\"$service\",pod=~\"$pod\"}) by (pod) - sum (redis_db_keys_expiring{service=~\"$service\",pod=~\"$pod\"}) by (pod)","format": "time_series","interval": "","intervalFactor": 2,"legendFormat": "not expiring, {{ pod }}","refId": "A","step": 240,"target": ""},{"expr": "sum (redis_db_keys_expiring{service=~\"$service\",pod=~\"$pod\"}) by (pod)","format": "time_series","interval": "","intervalFactor": 2,"legendFormat": "expiring, {{ pod }}","metric": "","refId": "B","step": 240}],"thresholds": [],"timeFrom": null,"timeRegions": [],"timeShift": null,"title": "Expiring vs Not-Expiring Keys","tooltip": {"msResolution": false,"shared": true,"sort": 0,"value_type": "individual"},"type": "graph","xaxis": {"buckets": null,"mode": "time","name": null,"show": true,"values": []},"yaxes": [{"format": "short","label": null,"logBase": 1,"max": null,"min": null,"show": true},{"format": "short","label": null,"logBase": 1,"max": null,"min": null,"show": true}],"yaxis": {"align": false,"alignLevel": null}},{"aliasColors": {"evicts": "#890F02","memcached_items_evicted_total{instance=\"172.17.0.1:9150\",job=\"prometheus\"}": "#890F02","reclaims": "#3F6833"},"bars": false,"dashLength": 10,"dashes": false,"datasource": "Prometheus","editable": true,"error": false,"fieldConfig": {"defaults": {"custom": {},"links": []},"overrides": []},"fill": 1,"fillGradient": 0,"grid": {},"gridPos": {"h": 7,"w": 12,"x": 0,"y": 21},"hiddenSeries": false,"id": 8,"isNew": true,"legend": {"avg": false,"current": false,"max": false,"min": false,"show": true,"total": false,"values": false},"lines": true,"linewidth": 2,"links": [],"nullPointMode": "connected","options": {"alertThreshold": true},"percentage": false,"pluginVersion": "7.4.2","pointradius": 5,"points": false,"renderer": "flot","seriesOverrides": [{"alias": "reclaims","yaxis": 2}],"spaceLength": 10,"stack": false,"steppedLine": false,"targets": [{"expr": "sum(rate(redis_expired_keys_total{service=~\"$service\",pod=~\"$pod\"}[5m])) by (pod)","format": "time_series","hide": false,"interval": "","intervalFactor": 2,"legendFormat": "expired, {{ pod }}","metric": "","refId": "A","step": 240,"target": ""},{"expr": "sum(rate(redis_evicted_keys_total{service=~\"$service\",pod=~\"$pod\"}[5m])) by (pod)","format": "time_series","interval": "","intervalFactor": 2,"legendFormat": "evicted, {{ pod }}","refId": "B","step": 240}],"thresholds": [],"timeFrom": null,"timeRegions": [],"timeShift": null,"title": "Expired/Evicted Keys","tooltip": {"msResolution": false,"shared": true,"sort": 0,"value_type": "cumulative"},"type": "graph","xaxis": {"buckets": null,"mode": "time","name": null,"show": true,"values": []},"yaxes": [{"format": "short","label": null,"logBase": 1,"max": null,"min": null,"show": true},{"format": "short","label": null,"logBase": 1,"max": null,"min": null,"show": true}],"yaxis": {"align": false,"alignLevel": null}},{"aliasColors": {},"bars": false,"dashLength": 10,"dashes": false,"datasource": "Prometheus","fieldConfig": {"defaults": {"custom": {},"links": []},"overrides": []},"fill": 1,"fillGradient": 0,"gridPos": {"h": 7,"w": 12,"x": 12,"y": 21},"hiddenSeries": false,"id": 16,"legend": {"avg": false,"current": false,"max": false,"min": false,"show": true,"total": false,"values": false},"lines": true,"linewidth": 1,"links": [],"nullPointMode": "null","options": {"alertThreshold": true},"percentage": false,"pluginVersion": "7.4.2","pointradius": 2,"points": false,"renderer": "flot","seriesOverrides": [],"spaceLength": 10,"stack": false,"steppedLine": false,"targets": [{"expr": "sum(redis_connected_clients{service=~\"$service\",pod=~\"$pod\"})","format": "time_series","intervalFactor": 1,"legendFormat": "connected","refId": "A"},{"expr": "sum(redis_blocked_clients{service=~\"$service\",pod=~\"$pod\"})","format": "time_series","intervalFactor": 1,"legendFormat": "blocked","refId": "B"}],"thresholds": [],"timeFrom": null,"timeRegions": [],"timeShift": null,"title": "Connected/Blocked Clients","tooltip": {"shared": true,"sort": 0,"value_type": "individual"},"type": "graph","xaxis": {"buckets": null,"mode": "time","name": null,"show": true,"values": []},"yaxes": [{"format": "short","label": null,"logBase": 1,"max": null,"min": null,"show": true},{"format": "short","label": null,"logBase": 1,"max": null,"min": null,"show": true}],"yaxis": {"align": false,"alignLevel": null}},{"aliasColors": {},"bars": false,"dashLength": 10,"dashes": false,"datasource": "Prometheus","editable": true,"error": false,"fieldConfig": {"defaults": {"custom": {},"links": []},"overrides": []},"fill": 2,"fillGradient": 0,"grid": {},"gridPos": {"h": 7,"w": 12,"x": 0,"y": 28},"hiddenSeries": false,"id": 20,"isNew": true,"legend": {"avg": false,"current": false,"hideEmpty": false,"hideZero": true,"max": false,"min": false,"show": true,"total": false,"values": false},"lines": true,"linewidth": 1,"links": [],"nullPointMode": "connected","options": {"alertThreshold": true},"percentage": false,"pluginVersion": "7.4.2","pointradius": 5,"points": false,"renderer": "flot","seriesOverrides": [],"spaceLength": 10,"stack": false,"steppedLine": false,"targets": [{"expr": "sum(irate(redis_commands_duration_seconds_total{service=~\"$service\",pod=~\"$pod\"}[1m])) by (cmd)\n  /\nsum(irate(redis_commands_total{service=~\"$service\",pod=~\"$pod\"}[1m])) by (cmd)\n","format": "time_series","interval": "","intervalFactor": 2,"legendFormat": "{{ cmd }}","metric": "redis_command_calls_total","refId": "A","step": 240}],"thresholds": [],"timeFrom": null,"timeRegions": [],"timeShift": null,"title": "Average Time Spent by Command / sec","tooltip": {"msResolution": true,"shared": true,"sort": 2,"value_type": "individual"},"type": "graph","xaxis": {"buckets": null,"mode": "time","name": null,"show": true,"values": []},"yaxes": [{"format": "s","label": null,"logBase": 1,"max": null,"min": null,"show": true},{"format": "short","label": null,"logBase": 1,"max": null,"min": null,"show": true}],"yaxis": {"align": false,"alignLevel": null}},{"aliasColors": {},"bars": false,"dashLength": 10,"dashes": false,"datasource": "Prometheus","editable": true,"error": false,"fieldConfig": {"defaults": {"custom": {},"links": []},"overrides": []},"fill": 8,"fillGradient": 0,"grid": {},"gridPos": {"h": 7,"w": 12,"x": 12,"y": 28},"hiddenSeries": false,"id": 14,"isNew": true,"legend": {"avg": false,"current": false,"hideEmpty": false,"hideZero": false,"max": false,"min": false,"show": true,"total": false,"values": false},"lines": true,"linewidth": 1,"links": [],"nullPointMode": "connected","options": {"alertThreshold": true},"percentage": false,"pluginVersion": "7.4.2","pointradius": 5,"points": false,"renderer": "flot","seriesOverrides": [],"spaceLength": 10,"stack": true,"steppedLine": false,"targets": [{"expr": "sum(irate(redis_commands_duration_seconds_total{service=~\"$service\",pod=~\"$pod\"}[1m])) by (cmd) != 0","format": "time_series","interval": "","intervalFactor": 2,"legendFormat": "{{ cmd }}","metric": "redis_command_calls_total","refId": "A","step": 240}],"thresholds": [],"timeFrom": null,"timeRegions": [],"timeShift": null,"title": "Total Time Spent by Command / sec","tooltip": {"msResolution": true,"shared": true,"sort": 2,"value_type": "individual"},"type": "graph","xaxis": {"buckets": null,"mode": "time","name": null,"show": true,"values": []},"yaxes": [{"format": "s","label": null,"logBase": 1,"max": null,"min": null,"show": true},{"format": "short","label": null,"logBase": 1,"max": null,"min": null,"show": true}],"yaxis": {"align": false,"alignLevel": null}}],"refresh": false,"schemaVersion": 27,"style": "dark","tags": ["prometheus","redis"],"templating": {"list": [{"allValue": null,"current": {"selected": true,"text": "lkirulxq-l46-redis-exporter-svc","value": "lkirulxq-l46-redis-exporter-svc"},"datasource": null,"definition": "label_values(redis_up,service)","description": null,"error": null,"hide": 0,"includeAll": false,"label": "Service","multi": false,"name": "service","options": [],"query": {"query": "label_values(redis_up,service)","refId": "StandardVariableQuery"},"refresh": 1,"regex": "","skipUrlSync": false,"sort": 1,"tagValuesQuery": "","tags": [],"tagsQuery": "","type": "query","useTags": false},{"allValue": null,"current": {"selected": false,"text": "lkirulxq-l46-redis-1","value": "lkirulxq-l46-redis-1"},"datasource": null,"definition": "label_values(redis_up{service=\"$service\"},pod)","description": null,"error": null,"hide": 0,"includeAll": false,"label": "Pod","multi": false,"name": "pod","options": [],"query": {"query": "label_values(redis_up{service=\"$service\"},pod)","refId": "StandardVariableQuery"},"refresh": 1,"regex": "","skipUrlSync": false,"sort": 0,"tagValuesQuery": "","tags": [],"tagsQuery": "","type": "query","useTags": false},{"auto": false,"auto_count": 30,"auto_min": "10s","current": {"selected": false,"text": "1s","value": "1s"},"description": null,"error": null,"hide": 0,"label": "Interval","name": "interval","options": [{"selected": true,"text": "1s","value": "1s"},{"selected": false,"text": "5s","value": "5s"},{"selected": false,"text": "1m","value": "1m"},{"selected": false,"text": "5m","value": "5m"},{"selected": false,"text": "1h","value": "1h"},{"selected": false,"text": "6h","value": "6h"},{"selected": false,"text": "1d","value": "1d"}],"query": "1s,5s,1m,5m,1h,6h,1d","refresh": 2,"skipUrlSync": false,"type": "interval"}]},"time": {"from": "now-24h","to": "now"},"timepicker": {"refresh_intervals": ["5s","10s","30s","1m","5m","15m","30m","1h","2h","1d"],"time_options": ["5m","15m","1h","6h","12h","24h","2d","7d","30d"]},"timezone": "browser","title": "Redis Overview","uid": "redis","version": 6
}