基于Hive的天气情况大数据分析系统(通过hive进行大数据分析将分析的数据通过sqoop导入到mysql,通过Django基于mysql的数据做可视化)
基于Hive的天气情况大数据分析系统(通过hive进行大数据分析将分析的数据通过sqoop导入到mysql,通过Django基于mysql的数据做可视化)
-
Hive介绍:
Hive是建立在Hadoop之上的数据仓库基础架构,它提供了类似于SQL的语言(HQL),可以对大规模数据集进行查询和分析。通过Hive,我们可以在分布式存储系统中进行复杂的数据处理和分析。 -
Sqoop简介:
Sqoop是一个用于在Apache Hadoop和关系型数据库之间传输数据的工具。我们可以使用Sqoop将Hive中的分析结果导出到关系型数据库中,如MySQL,以便进一步处理和可视化。 -
Django概述:
Django是一个高级的Python Web框架,它提供了一系列工具和库,用于快速构建Web应用程序。我们可以利用Django连接到MySQL数据库,处理数据,并将其呈现为可视化界面。
Hive大数据分析sql,基于数据创建hive表,然后进行数据分析
-- 创建数据库
CREATE DATABASE IF NOT EXISTS big_data;-- 切换到big_data数据库
USE big_data;load data local inpath '/export/server/28' INTO TABLE weather_data;
-- 创建weather_data表
CREATE TABLE IF NOT EXISTS weather_data (`date` STRING,high_temperature STRING,low_temperature STRING,weather STRING,wind_direction STRING,city STRING
)ROW FORMAT DELIMITED
FIELDS TERMINATED BY ',';-- 插入数据到weather_data表(示例数据)
INSERT INTO TABLE weather_data VALUES
(1, '2022-01-01 周六', '6°', '-7°', '晴', '西北风3级', '北京'),
(2, '2022-01-02 周日', '2°', '-7°', '多云', '南风2级', '北京');-- 创建etl_weather_data表
CREATE TABLE IF NOT EXISTS etl_weather_data (`date` STRING,day_of_week STRING,high_temperature INT,low_temperature INT,weather STRING,wind_direction STRING,wind_speed STRING,city STRING
);-- 插入数据到etl_weather_data表
INSERT INTO TABLE etl_weather_data
SELECTSUBSTR(`date`, 1, INSTR(`date`, ' ') - 1) AS `date`,SUBSTR(`date`, INSTR(`date`, ' ') + 1) AS day_of_week,CAST(SUBSTR(high_temperature, 1, INSTR(high_temperature, '°') - 1) AS INT) AS high_temperature,CAST(SUBSTR(low_temperature, 1, INSTR(low_temperature, '°') - 1) AS INT) AS low_temperature,weather,REGEXP_REPLACE(SUBSTR(wind_direction, 1, INSTR(wind_direction, '级') - 1), '[0-9]', '') AS wind_direction,SUBSTR(SUBSTR(wind_direction, INSTR(wind_direction, '风') + 1),1,1) AS wind_speed,city
FROMweather_data;-- 1.统计一年中每个城市晴天个数的top10
CREATE TABLE IF NOT EXISTS top_sunny_cities (city STRING,sunny_days_count INT
);INSERT INTO TABLE top_sunny_cities
SELECTcity,COUNT(*) AS sunny_days_count
FROMetl_weather_data
WHEREweather LIKE '%晴%'
GROUP BYcity
ORDER BYsunny_days_count DESC
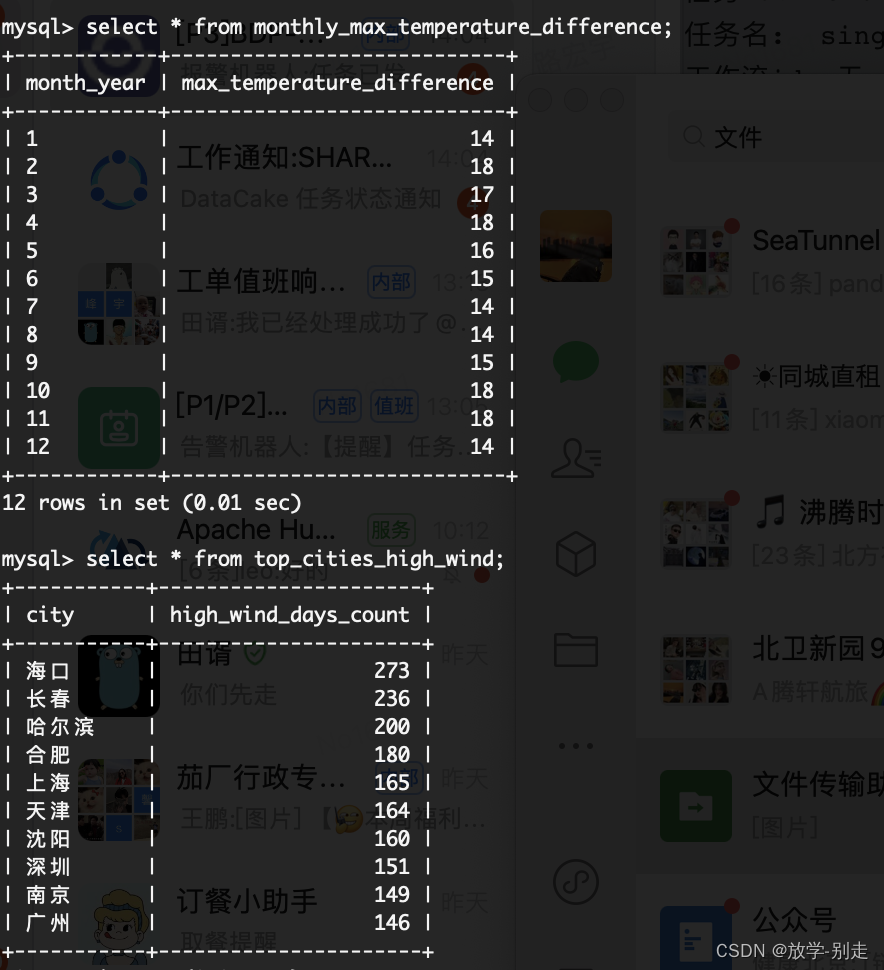
LIMIT 10;-- 2.统计北京一年中每个月的温差变化
CREATE TABLE IF NOT EXISTS monthly_max_temperature_difference (month_year STRING,max_temperature_difference INT
);INSERT INTO TABLE monthly_max_temperature_difference
SELECTCONCAT(YEAR(`date`), '-', LPAD(MONTH(`date`), 2, '0')) AS month_year,MAX(high_temperature - low_temperature) AS max_temperature_difference
FROMetl_weather_data
WHEREcity = '北京'
GROUP BYYEAR(`date`), MONTH(`date`);-- 3.统计城市出现3级以上风速最多的10个城市
CREATE TABLE IF NOT EXISTS top_cities_high_wind (city STRING,high_wind_days_count INT
);INSERT INTO TABLE top_cities_high_wind
SELECTcity,COUNT(*) AS high_wind_days_count
FROMetl_weather_data
WHERECAST(wind_speed AS INT) >= 3
GROUP BYcity
ORDER BYhigh_wind_days_count DESC
LIMIT 10;
基于sqoop将数据导入到mysql中
sqoop export \--connect jdbc:mysql://192.168.138.1:3306/big_data \--username root --password '123456' \--table top_sunny_cities_sqoop \--export-dir /hive/warehouse/big_data.db/big_data.dbbig_data.db/top_sunny_cities \--input-fields-terminated-by '\001' \--input-lines-terminated-by '\n';sqoop export \--connect jdbc:mysql:// 192.168.138.1:3306/big_data \--username root --password 123456 \--table monthly_max_temperature_difference \--export-dir /user/hive/warehouse/big_data.db/big_data.dbmonthly_max_temperature_difference \--input-fields-terminated-by '\001' \--input-lines-terminated-by '\n'sqoop export \--connect jdbc:mysql:// 192.168.138.1:3306/big_data \--username root --password 123456 \--table top_cities_high_wind \--export-dir /user/hive/warehouse/big_data.db/big_data.dbtop_cities_high_wind \--input-fields-terminated-by '\001' \--input-lines-terminated-by '\n'
基于mysql数据使用Django做数据可视化
from django.contrib.auth.decorators import login_required
from django.http import HttpResponse
from django.shortcuts import render, redirect
from django.shortcuts import render
from pyecharts import options as opts
from pyecharts.charts import Line, Bar, Pie, Grid
# Create your views here.from django.shortcuts import render
from pyecharts.globals import ThemeTypefrom api.service.task_service import get_user, top_sunny_cities, monthly_max_temperature_difference, \top_cities_high_wind, top_rainy_cities, monthly_rainy_days, yearly_min_temperatures, daily_wind_speed, \daily_temperature_difference, register_userdef login_page(request):if request.method == 'POST':username = request.POST.get('username')password = request.POST.get('password')user = get_user(username,password)if user is not None:return redirect('home')else:return render(request, 'login.html', {'error_message': 'Invalid login credentials.'})return render(request, 'login.html')def register_view(request):# 处理注册逻辑if request.method == 'GET':username = request.GET.get('username')password = request.GET.get('password')if username and password:register_user(username,password)return HttpResponse("注册成功!")return render(request, 'register.html')  # 使用你的注册模板路径def home(request):print(2)return render(request, 'home.html')def data_analysis(request, button_id):return render(request, 'data_analysis.html', {'button_id': button_id})def data_analysis(request, button_id):# 根据按钮 ID 进行不同的处理if button_id == 1:x,y = top_sunny_cities()line_chart = (Line().add_xaxis(xaxis_data=x).add_yaxis(series_name="晴天个数", y_axis=y).set_global_opts(title_opts=opts.TitleOpts(title="一年中每个城市晴天个数的top10")))chart_html = line_chart.render_embed()button_name = "折线图"elif button_id == 2:x,y = monthly_max_temperature_difference()line_chart = (Line().add_xaxis(xaxis_data=x).add_yaxis(series_name="温差值", y_axis=y).set_global_opts(title_opts=opts.TitleOpts(title="北京一年中每个月的温差变化")))chart_html = line_chart.render_embed()button_name = "折线图"elif button_id == 3:x,y = top_cities_high_wind()bar_chart = (Bar().add_xaxis(xaxis_data=x).add_yaxis(series_name="3级风速次数",y_axis=y).set_global_opts(title_opts=opts.TitleOpts(title="出现3级以上风速的top10个城市")))chart_html = bar_chart.render_embed()button_name = "条形图"elif button_id == 4:x, y = top_rainy_cities()bar_chart = (Bar().add_xaxis(xaxis_data=x).add_yaxis(series_name="雨天数量", y_axis=y).set_global_opts(title_opts=opts.TitleOpts(title="多雨城市的top10")))chart_html = bar_chart.render_embed()button_name = "条形图"elif button_id == 5:x, y = monthly_rainy_days()pie = Pie()pie.add("", list(zip(x, y)))pie.set_global_opts(title_opts={"text": "杭州每月雨天变化", "subtext": "2022年"},legend_opts=opts.LegendOpts(orient="vertical", pos_right="right", pos_top="center"))chart_html = pie.render_embed()button_name = "饼图"elif button_id == 6:x, y = yearly_min_temperatures()line_chart = (Line().add_xaxis(xaxis_data=x).add_yaxis(series_name="温度", y_axis=y).set_global_opts(title_opts=opts.TitleOpts(title="城市一年中最低的温度top10")))chart_html = line_chart.render_embed()button_name = "折线图"elif button_id == 7:x,y=daily_temperature_difference()# 创建饼图pie = (Pie(init_opts=opts.InitOpts(width="800px", height="600px")).add(series_name="南京10月份1~10号温差变化",data_pair=list(zip(x, y)),radius=["40%", "75%"],  # 设置内外半径,实现空心效果label_opts=opts.LabelOpts(is_show=True, position="inside"),).set_global_opts(title_opts=opts.TitleOpts(title="南京10月份1~10号温差变化"),legend_opts=opts.LegendOpts(orient="vertical", pos_right="right", pos_top="center"),).set_series_opts(  # 设置系列选项,调整 is_show 阈值label_opts=opts.LabelOpts(is_show=True)))chart_html = pie.render_embed()button_name = "饼图"elif button_id == 8:x,y=daily_wind_speed()bar_chart = (Bar().add_xaxis(xaxis_data=x).add_yaxis(series_name="风速级别", y_axis=y).set_global_opts(title_opts=opts.TitleOpts(title="南京10月份每天的风速变化")))chart_html = bar_chart.render_embed()button_name = "条形图"return render(request, 'data_analysis.html', {'chart_html': chart_html, 'button_name': button_name})
展示Django项目运行结果


如有遇到问题可以找小编沟通交流哦。另外小编帮忙辅导大课作业,学生毕设等。不限于python,java,大数据等。
