2019独角兽企业重金招聘Python工程师标准>>> 
一、前言
1、Hystrix Dashboard的作用?
上一篇我们介绍了Hystrix的基础使用,我们可以通过Hystrix做到依赖隔离和熔断等操作。但是只有工具的使用而没有监控,我们就无法在第一时间发现出现问题的依赖,也不能判断服务整体的健康状态/运行状态。所以我们还要做好相关的监控工作。
Hystrix提供了监控页面,本篇主要介绍如何使用Hystrix Dashboard对服务的容错情况进行监控。
2、本篇环境信息
| 框架 | 版本 |
|---|---|
| Spring Boot | 2.0.0.RELEASE |
| Spring Cloud | Finchley.BUILD-SNAPSHOT |
| JDK | 1.8.x |
3、准备工作
- 准备Eureka Server、服务提供者
参考:https://ken.io/note/spring-cloud-feign-quickstart
源码:https://github.com/ken-io/springcloud-course/tree/master/chapter-03/
启动Eureka Server: http://localhost:8800
启动Test Service:http://localhost:8602
- 服务消费者准备
基于上一篇Feign+Hystrix:https://ken.io/note/spring-cloud-hystrix-quickstart
源码(feignclient):https://github.com/ken-io/springcloud-course/tree/master/chapter-04/feignclient
二、Hystrix Dashboard
基于feignclient项目使用Hystrix Dashboard
1、项目中引入Hystrix Dashboard
<dependency>
    <groupId>org.springframework.boot</groupId>
    <artifactId>spring-boot-starter-actuator</artifactId>
</dependency>

<dependency>
    <groupId>org.springframework.cloud</groupId>
    <artifactId>spring-cloud-starter-netflix-hystrix-dashboard</artifactId>
</dependency>
2、配置Hystrix Dashboard启动
修改App.java,增加 @EnableHystrixDashboard 注解
package io.ken.springcloud.feignclient;

import org.springframework.boot.SpringApplication;
import org.springframework.boot.autoconfigure.SpringBootApplication;
import org.springframework.cloud.client.discovery.EnableDiscoveryClient;
import org.springframework.cloud.netflix.hystrix.dashboard.EnableHystrixDashboard;
import org.springframework.cloud.openfeign.EnableFeignClients;

@EnableHystrixDashboard
@EnableFeignClients
@EnableDiscoveryClient
@SpringBootApplication
public class App {

    public static void main(String[] args) {
        SpringApplication.run(App.class, args);
    }

}
3、配置HystrixMetricsStream访问入口
新建package:configuration,然后在此package下创建HystrixConfiguration.java并添加hystrixRegistrationBean
package io.ken.springcloud.feignclient.configuration;

import com.netflix.hystrix.contrib.metrics.eventstream.HystrixMetricsStreamServlet;
import org.springframework.boot.web.servlet.ServletRegistrationBean;
import org.springframework.context.annotation.Bean;
import org.springframework.context.annotation.Configuration;

@Configuration
public class HystrixConfiguration {

    @Bean(name = "hystrixRegistrationBean")
    public ServletRegistrationBean servletRegistrationBean() {
        ServletRegistrationBean registration = new ServletRegistrationBean(
                new HystrixMetricsStreamServlet(), "/hystrix.stream");
        registration.setName("hystrixServlet");
        registration.setLoadOnStartup(1);
        return registration;
    }
}
4、Hystrix Dashboard测试
feignclient项目启动后,访问 http://localhost:8605/hystrix
将会看到Hystrix Dashboard导航页
Hystrix Dashboard导航页不会展示具体监控信息,而是提供三种选择:
-
默认的集群监控,通过URL:http://turbine-hostname:port/turbine.stream,查看默认集群的监控信息。
-
指定的集群监控,通过URL:http://turbine-hostname:port/turbine.stream?cluster=[clusterName],查看指定集群(clusterName)的监控信息。
-
单个实例的监控,通过URL:http://hystrix-app:port/hystrix.stream,查看具体某个服务实例的监控信息。
我们先通过Hystrix Dashboard看一下单个实例的监控信息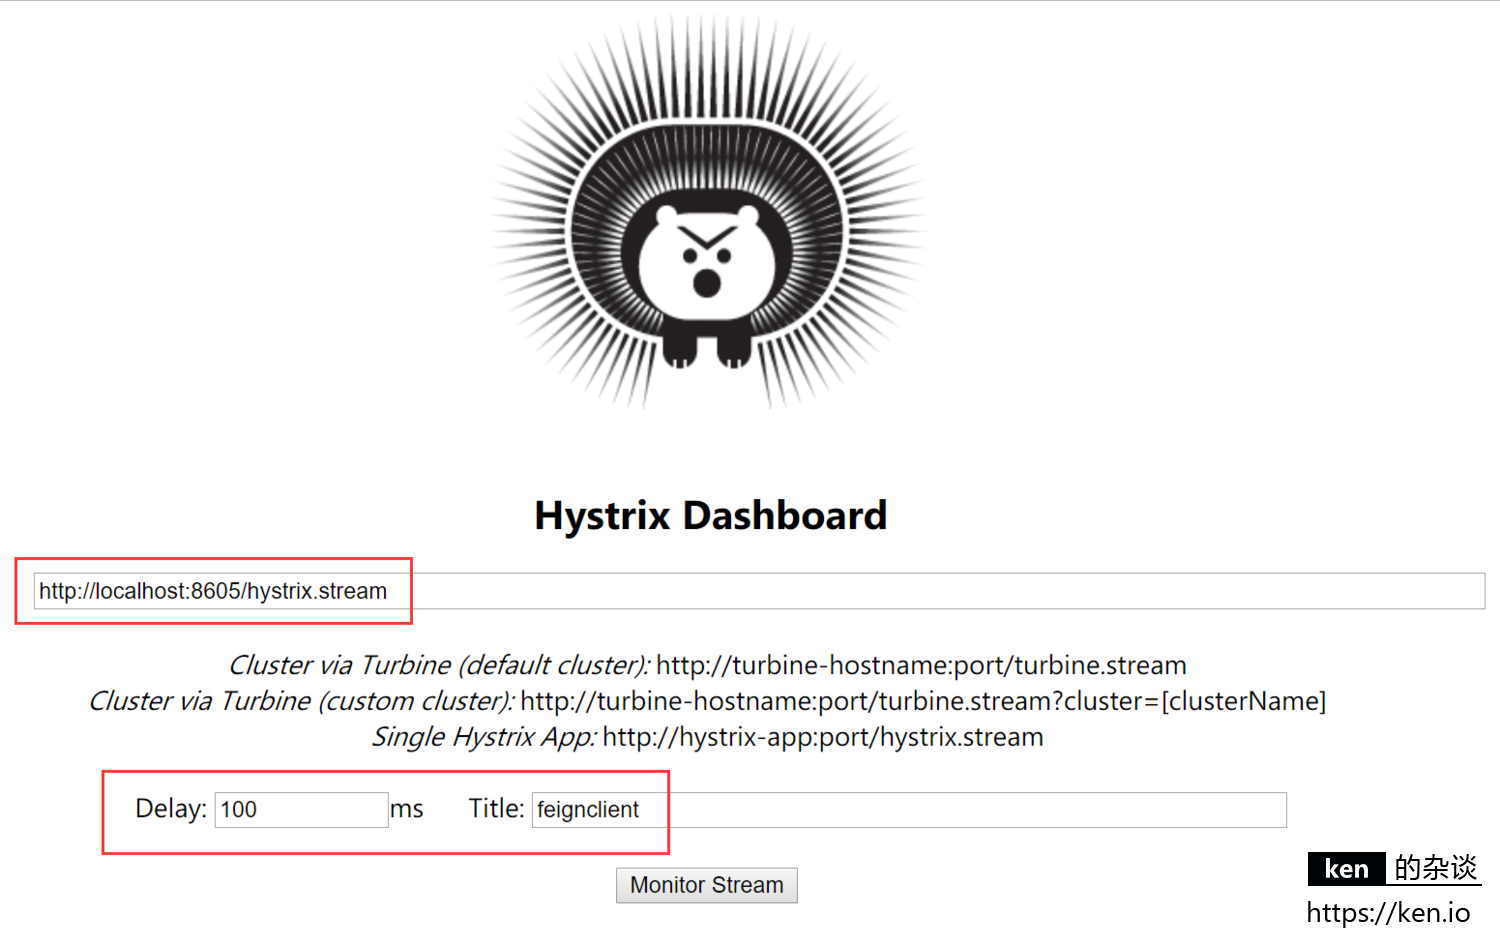
输入指定连接:http://localhost:8605/hystrix.stream
Delay(查询监控信息的延迟时间),Tile可以自定义,也可以默认。填写完毕点击 Monitor Stream 即可
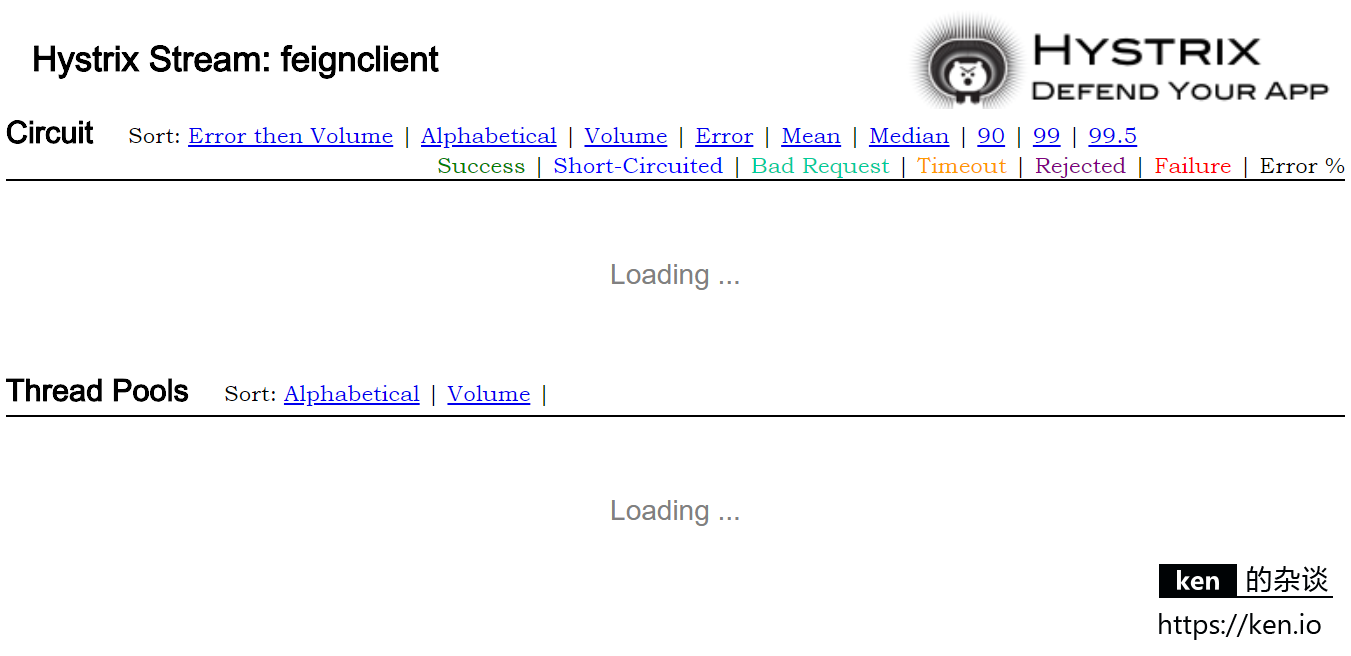
此时Hystrix监控面板会显示Loanding…,这是因为我们还没通过feignclient访问外部接口,也就还没生成stream信息。
我们通过feignclient访问几个外部接口,stream信息生成后,监控面板会自动刷新。
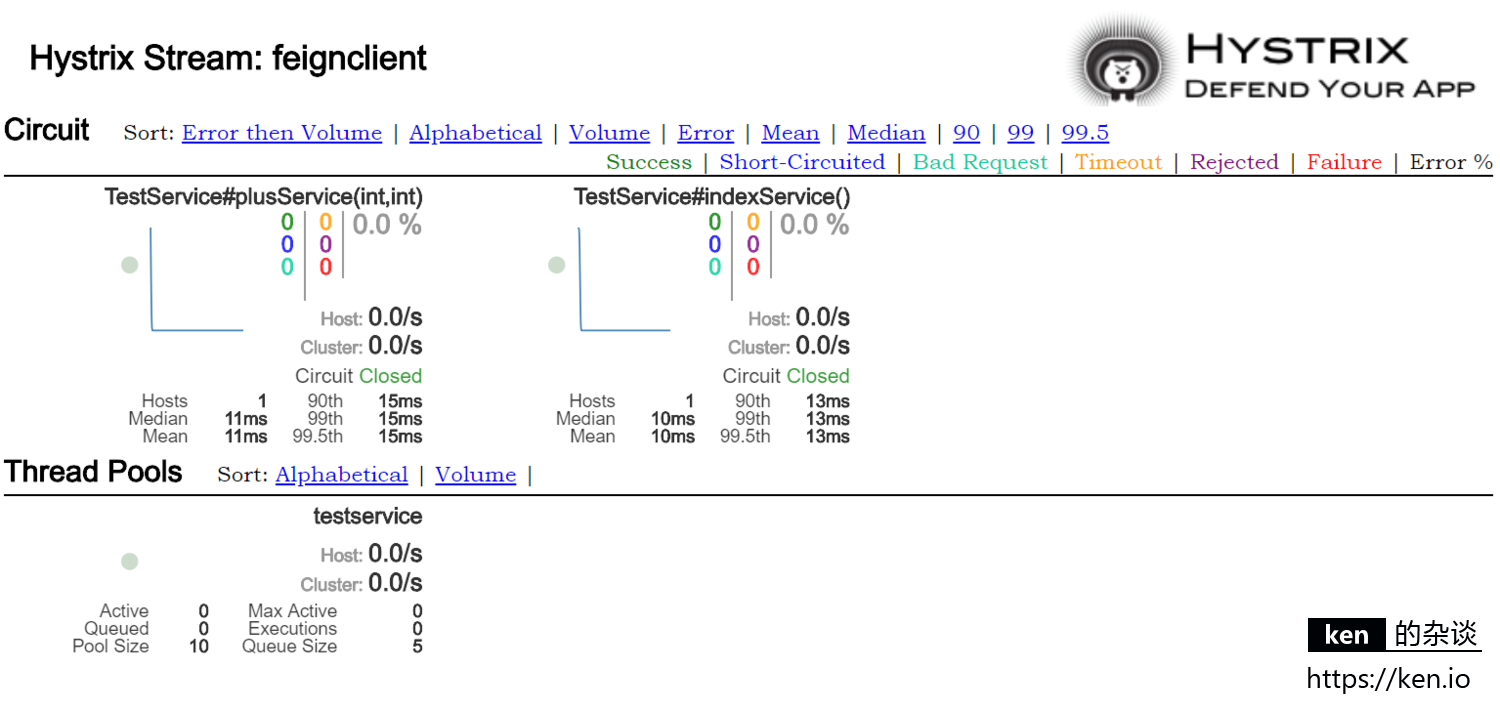
在访问了 http://localhost:8605/ti ,http://localhost:8605/plus?numa=1&numb=2
这两个接口后,监控信息就自然刷新了。不同的接口默认会分开来记录。
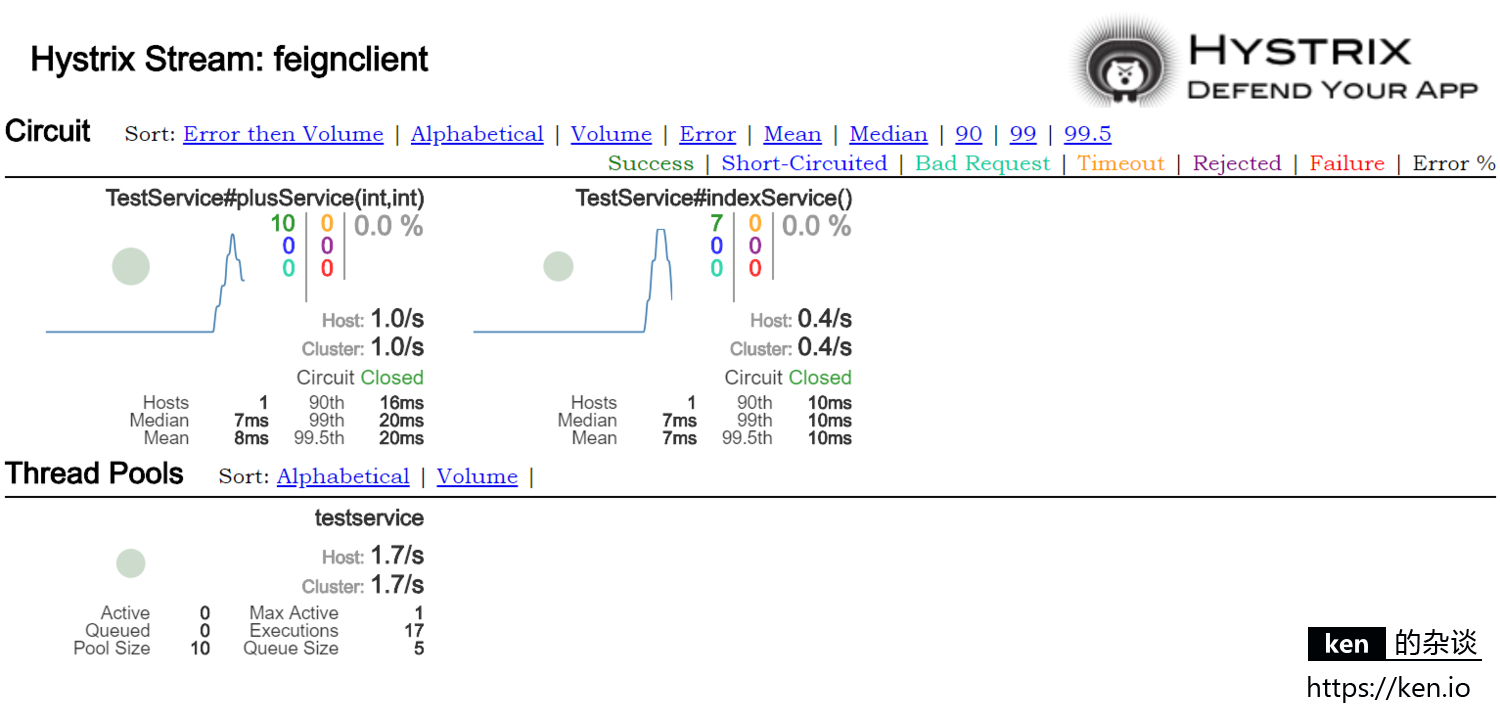
监控图中用圆点来表示服务的健康状态,健康度从100%-0%分别会用绿色、黄色、橙色、红色来表示。
另外,这个圆点也会随着流量的增多而变大。
监控图中会用曲线(圆点旁边)来表示服务的流量情况,通过这个曲线可以观察单个接口的流量变化/趋势
上个图中是个非常小的绿色圆心,流量曲线也是个折现,是因为 ken.io 这里访问两个接口次数很少。
如果分别狂按F5快速访问这两个接口。这个圆心和曲线就会发生变化。
这时候这个圆点比着上一张图已经变大了,服务依旧是健康状态,所以圆点还是绿色。
另外流量曲线随着刚才的快速刷新访问也升了上去。
为了更好的展示服务不同健康状态下面板的变化,我们快速访问 http://localhost:8605/ti , http://localhost:8605/plus?numa=1&numb=2,然后关闭testservice,快速的访问 http://localhost:8605/plus?numa=1&numb=2 ,这首的面板会更丰富。
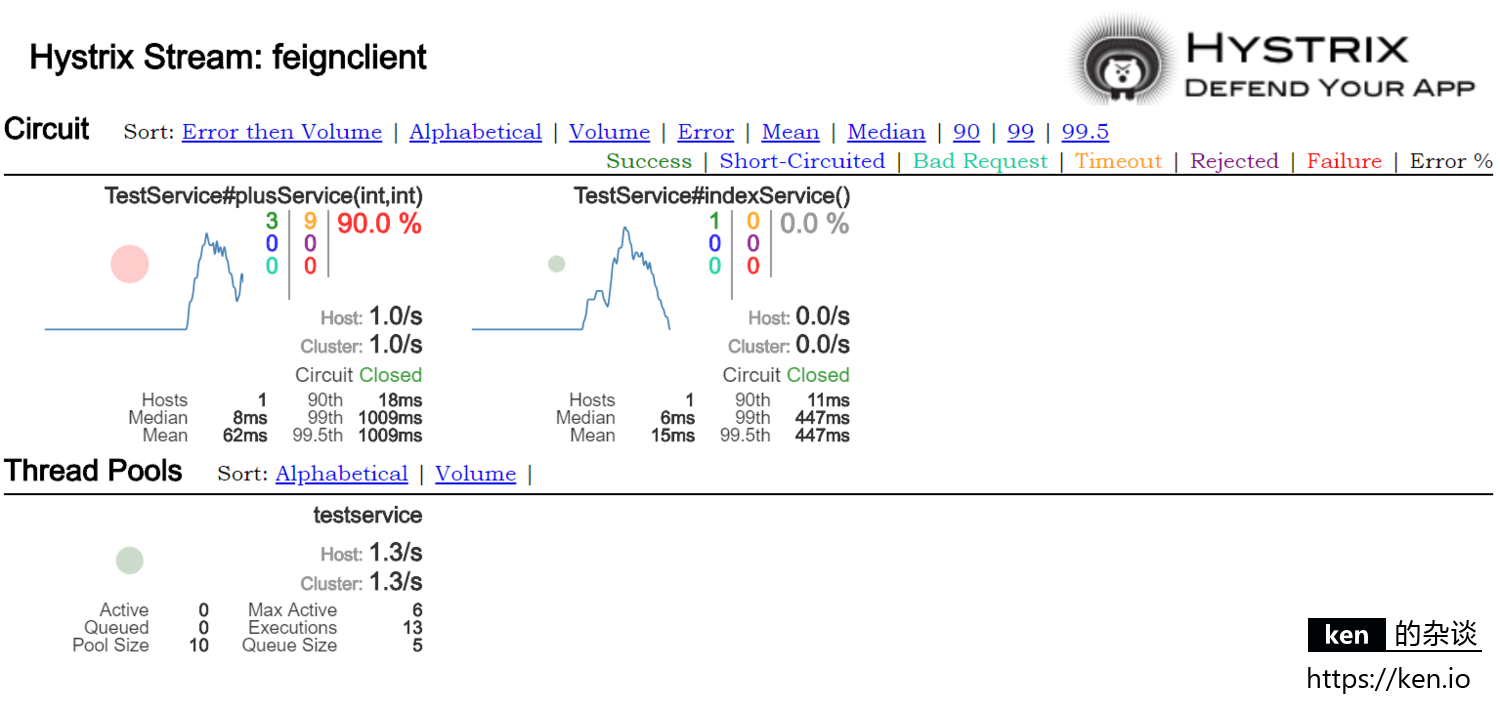
这时候TestService#plusService的圆点就变成了红色。由于停用testservice后我们没有访问 http://localhost:8605/ti ,所以这个时间点TestService#plusService的圆点还是绿色,尺寸也更小。两个Service的流量曲线变化也跟我们的操作相吻合。
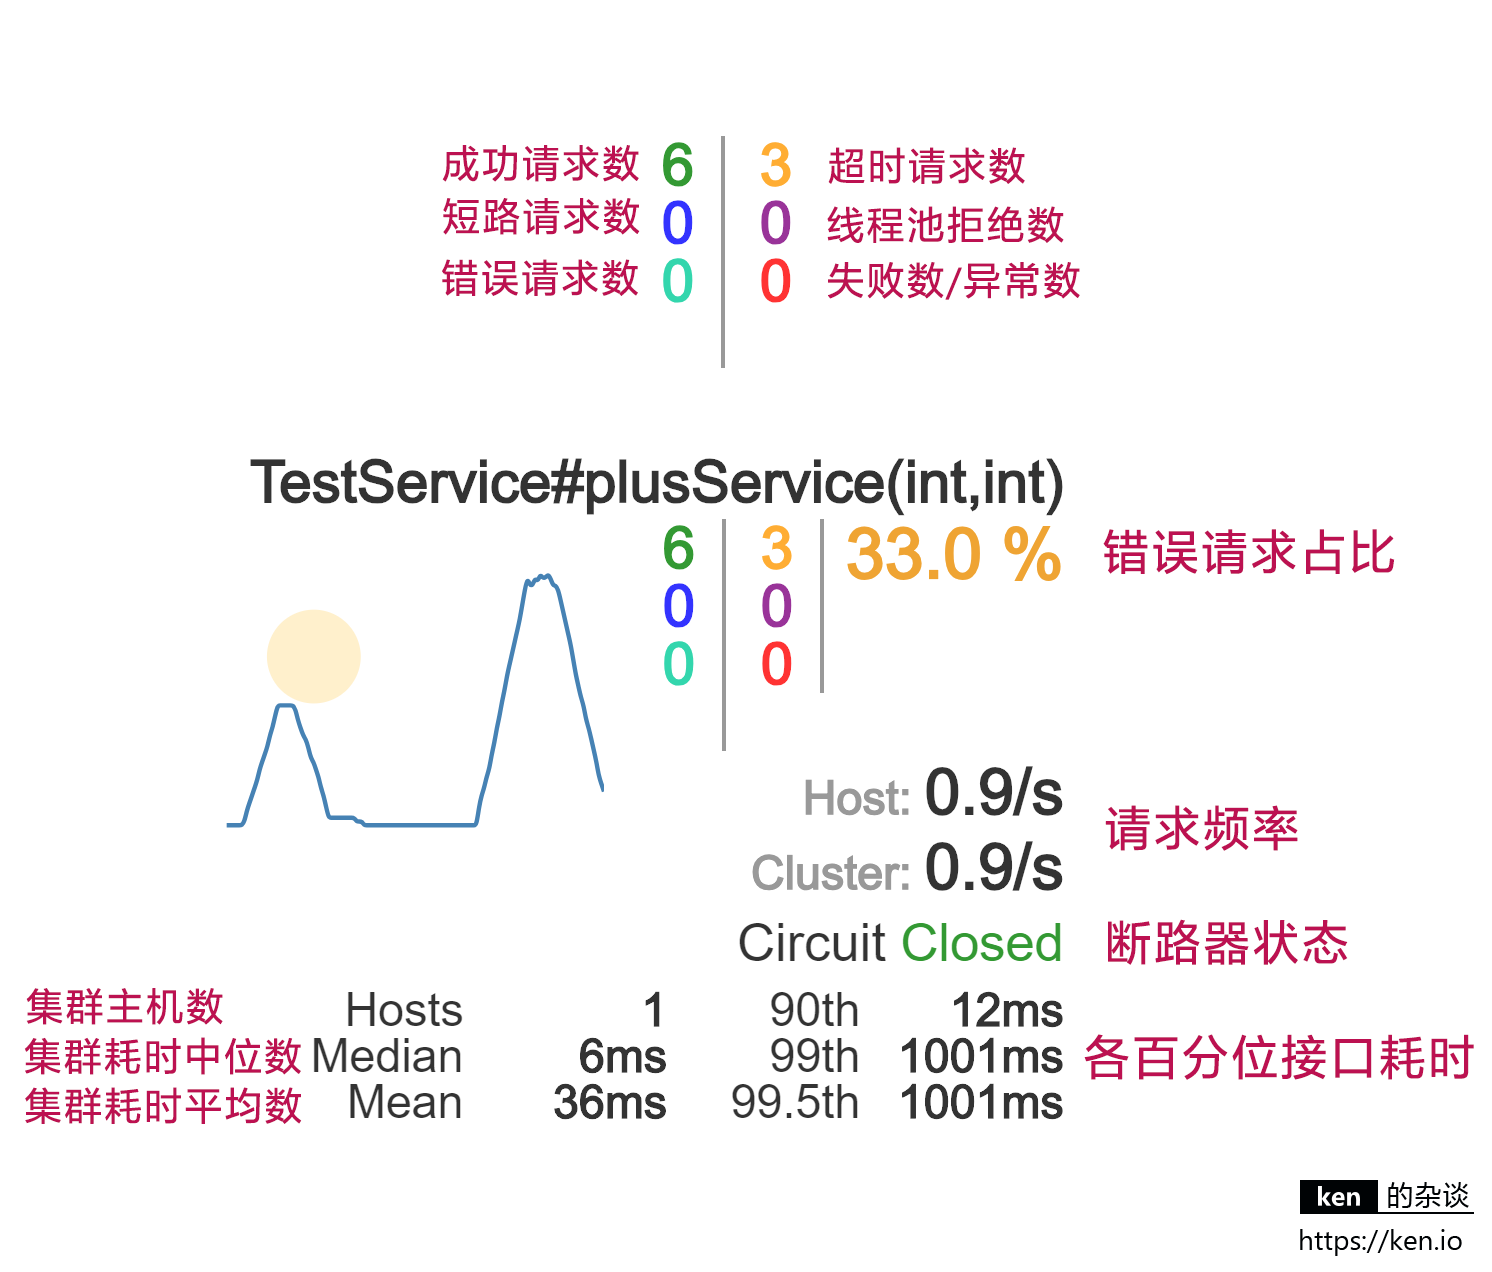
上图是Hystrix Dashboard监控图表中各项指标的说明