【云原生 | Kubernetes 系列】----使用Prometheus监控K8s集群
使用Prometheus监控K8s集群
1. daemonset方式部署node-exporter
将node的/proc,/sys,/分别隐射到node-exporter中,这样就能监控node的状态
apiVersion: apps/v1
kind: DaemonSet
metadata:
  name: node-exporter
  namespace: monitoring
  labels:
    k8s-app: node-exporter
spec:
  selector:
    matchLabels:
        k8s-app: node-exporter
  template:
    metadata:
      labels:
        k8s-app: node-exporter
    spec:
      tolerations:
        - effect: NoSchedule
          key: node-role.kubernetes.io/master
      containers:
      - image: harbor.intra.com/prometheus/node-exporter:v1.3.1
        imagePullPolicy: IfNotPresent
        name: prometheus-node-exporter
        ports:
        - containerPort: 9100
          hostPort: 9100
          protocol: TCP
          name: metrics
        volumeMounts:
        - mountPath: /host/proc
          name: proc
        - mountPath: /host/sys
          name: sys
        - mountPath: /host
          name: rootfs
        args:
        - --path.procfs=/host/proc
        - --path.sysfs=/host/sys
        - --path.rootfs=/host
      volumes:
        - name: proc
          hostPath:
            path: /proc
        - name: sys
          hostPath:
            path: /sys
        - name: rootfs
          hostPath:
            path: /
      hostNetwork: true
      hostPID: true
---
apiVersion: v1
kind: Service
metadata:
  annotations:
    prometheus.io/scrape: "true"
  labels:
    k8s-app: node-exporter
  name: node-exporter
  namespace: monitoring
spec:
  type: NodePort
  ports:
  - name: http
    port: 9100
    nodePort: 39100
    protocol: TCP
  selector:
    k8s-app: node-exporter
2. 部署node-exporter
先创建namespace,再执行yaml
kubectl create ns monitoring
kubectl apply -f case2-daemonset-deploy-node-exporter.yaml
此时node-exporter已经以daemonset的方式跑在每个节点之上
root@k8s-master-01:/opt/k8s-data/yaml/prometheus-files/case# kubectl get pods -n monitoring -o wide
NAME                  READY   STATUS    RESTARTS   AGE    IP               NODE             NOMINATED NODE   READINESS GATES
node-exporter-gmkmh   1/1     Running   0          4m8s   192.168.31.113   192.168.31.113   <none>           <none>
node-exporter-hjd4c   1/1     Running   0          4m8s   192.168.31.102   192.168.31.102   <none>           <none>
node-exporter-mg72x   1/1     Running   0          4m8s   192.168.31.101   192.168.31.101   <none>           <none>
node-exporter-vvhtw   1/1     Running   0          4m8s   192.168.31.112   192.168.31.112   <none>           <none>
node-exporter-wxkw9   1/1     Running   0          4m8s   192.168.31.111   192.168.31.111   <none>           <none>
node-exporter-z4w6t   1/1     Running   0          4m8s   192.168.31.103   192.168.31.103   <none>           <none>
node-exporter-zk6c2   1/1     Running   0          4m8s   192.168.31.114   192.168.31.114   <none>           <none>
3. 创建Prometheus configMap
prometheus-cfg.yaml
---
kind: ConfigMap
apiVersion: v1
metadata:
  labels:
    app: prometheus
  name: prometheus-config
  namespace: monitoring
data:
  prometheus.yml: |
    global:
      scrape_interval: 15s
      scrape_timeout: 10s
      evaluation_interval: 1m
    scrape_configs:
    - job_name: 'kubernetes-node'
      kubernetes_sd_configs:
      - role: node
      relabel_configs:
      - source_labels: [__address__]
        regex: '(.*):10250'
        replacement: '${1}:9100'
        target_label: __address__
        action: replace
      - action: labelmap
        regex: __meta_kubernetes_node_label_(.+)
    - job_name: 'kubernetes-node-cadvisor'
      kubernetes_sd_configs:
      - role:  node
      scheme: https
      tls_config:
        ca_file: /var/run/secrets/kubernetes.io/serviceaccount/ca.crt
      bearer_token_file: /var/run/secrets/kubernetes.io/serviceaccount/token
      relabel_configs:
      - action: labelmap
        regex: __meta_kubernetes_node_label_(.+)
      - target_label: __address__
        replacement: kubernetes.default.svc:443
      - source_labels: [__meta_kubernetes_node_name]
        regex: (.+)
        target_label: __metrics_path__
        replacement: /api/v1/nodes/${1}/proxy/metrics/cadvisor

    - job_name: 'kubernetes-service-endpoints'
      kubernetes_sd_configs:
      - role: endpoints
      relabel_configs:
      - source_labels: [__meta_kubernetes_service_annotation_prometheus_io_scrape]
        action: keep
        regex: true
      - source_labels: [__meta_kubernetes_service_annotation_prometheus_io_scheme]
        action: replace
        target_label: __scheme__
        regex: (https?)
      - source_labels: [__meta_kubernetes_service_annotation_prometheus_io_path]
        action: replace
        target_label: __metrics_path__
        regex: (.+)
      - source_labels: [__address__, __meta_kubernetes_service_annotation_prometheus_io_port]
        action: replace
        target_label: __address__
        regex: ([^:]+)(?::\d+)?;(\d+)
        replacement: $1:$2
      - action: labelmap
        regex: __meta_kubernetes_service_label_(.+)
      - source_labels: [__meta_kubernetes_namespace]
        action: replace
        target_label: kubernetes_namespace
      - source_labels: [__meta_kubernetes_service_name]
        action: replace
        target_label: kubernetes_name


    - job_name: 'kubernetes-apiserver'
      kubernetes_sd_configs:
      - role: endpoints
      scheme: https
      tls_config:
        ca_file: /var/run/secrets/kubernetes.io/serviceaccount/ca.crt
      bearer_token_file: /var/run/secrets/kubernetes.io/serviceaccount/token
      relabel_configs:
      - source_labels: [__meta_kubernetes_namespace, __meta_kubernetes_service_name, __meta_kubernetes_endpoint_port_name]
        action: keep
        regex: default;kubernetes;https
部署configMap
root@k8s-master-01:/opt/k8s-data/yaml/prometheus-files/case# kubectl apply -f prometheus-cfg.yaml
configmap/prometheus-config created
在113服务器上创建目录用作prometheus-storage-volume
root@k8s-node-3:~# mkdir -p /data/prometheusdata
chmod 777 /data/prometheusdata
创建监控账号
root@k8s-master-01:/opt/k8s-data/yaml/prometheus-files/case# kubectl create serviceaccount monitor -n monitoring
serviceaccount/monitor created
授权账号可以服务发现
root@k8s-master-01:/opt/k8s-data/yaml/prometheus-files/case# kubectl create clusterrolebinding monitor-clusterrolebinding -n monitoring --clusterrole=cluster-admin --serviceaccount=monitoring:monitor
clusterrolebinding.rbac.authorization.k8s.io/monitor-clusterrolebinding created
4. 创建Prometheus deployment
prometheus-deployment.yaml
---
apiVersion: apps/v1
kind: Deployment
metadata:
  name: prometheus-server
  namespace: monitoring
  labels:
    app: prometheus
spec:
  replicas: 1
  selector:
    matchLabels:
      app: prometheus
      component: server
    #matchExpressions:
    #- {key: app, operator: In, values: [prometheus]}
    #- {key: component, operator: In, values: [server]}
  template:
    metadata:
      labels:
        app: prometheus
        component: server
      annotations:
        prometheus.io/scrape: 'false'
    spec:
      nodeName: 192.168.31.113
      serviceAccountName: monitor
      containers:
      - name: prometheus
        image: harbor.intra.com/prometheus/prometheus:v2.32.1
        imagePullPolicy: IfNotPresent
        command:
          - prometheus
          - --config.file=/etc/prometheus/prometheus.yml
          - --storage.tsdb.path=/prometheus
          - --storage.tsdb.retention=720h
        ports:
        - containerPort: 9090
          protocol: TCP
        volumeMounts:
        - mountPath: /etc/prometheus/prometheus.yml
          name: prometheus-config
          subPath: prometheus.yml
        - mountPath: /prometheus/
          name: prometheus-storage-volume
      volumes:
        - name: prometheus-config
          configMap:
            name: prometheus-config
            items:
              - key: prometheus.yml
                path: prometheus.yml
                mode: 0644
        - name: prometheus-storage-volume
          hostPath:
           path: /data/prometheusdata
           type: Directory
部署deployment
root@k8s-master-01:/opt/k8s-data/yaml/prometheus-files/case# kubectl apply -f prometheus-deployment.yaml
deployment.apps/prometheus-server created
5. 创建Prometheus Service
暴露服务器30090端口,映射给prometheus
---
apiVersion: v1
kind: Service
metadata:
  name: prometheus
  namespace: monitoring
  labels:
    app: prometheus
spec:
  type: NodePort
  ports:
    - port: 9090
      targetPort: 9090
      nodePort: 30090
      protocol: TCP
  selector:
    app: prometheus
    component: server
查看svc暴露的端口,及后端服务器
root@k8s-master-01:/opt/k8s-data/yaml/prometheus-files/case1/prometheus-files/case# kubectl get svc -n monitoring
NAME            TYPE       CLUSTER-IP       EXTERNAL-IP   PORT(S)          AGE
node-exporter   NodePort   10.200.150.142   <none>        9100:39100/TCP   11m
prometheus      NodePort   10.200.241.145   <none>        9090:30090/TCP   4m1s
root@k8s-master-01:/opt/k8s-data/yaml/prometheus-files/case1/prometheus-files/case# kubectl get ep -n monitoring
NAME            ENDPOINTS                                                                 AGE
node-exporter   192.168.31.101:9100,192.168.31.102:9100,192.168.31.103:9100 + 4 more...   11m
prometheus      172.100.76.132:9090                                                       4m27s
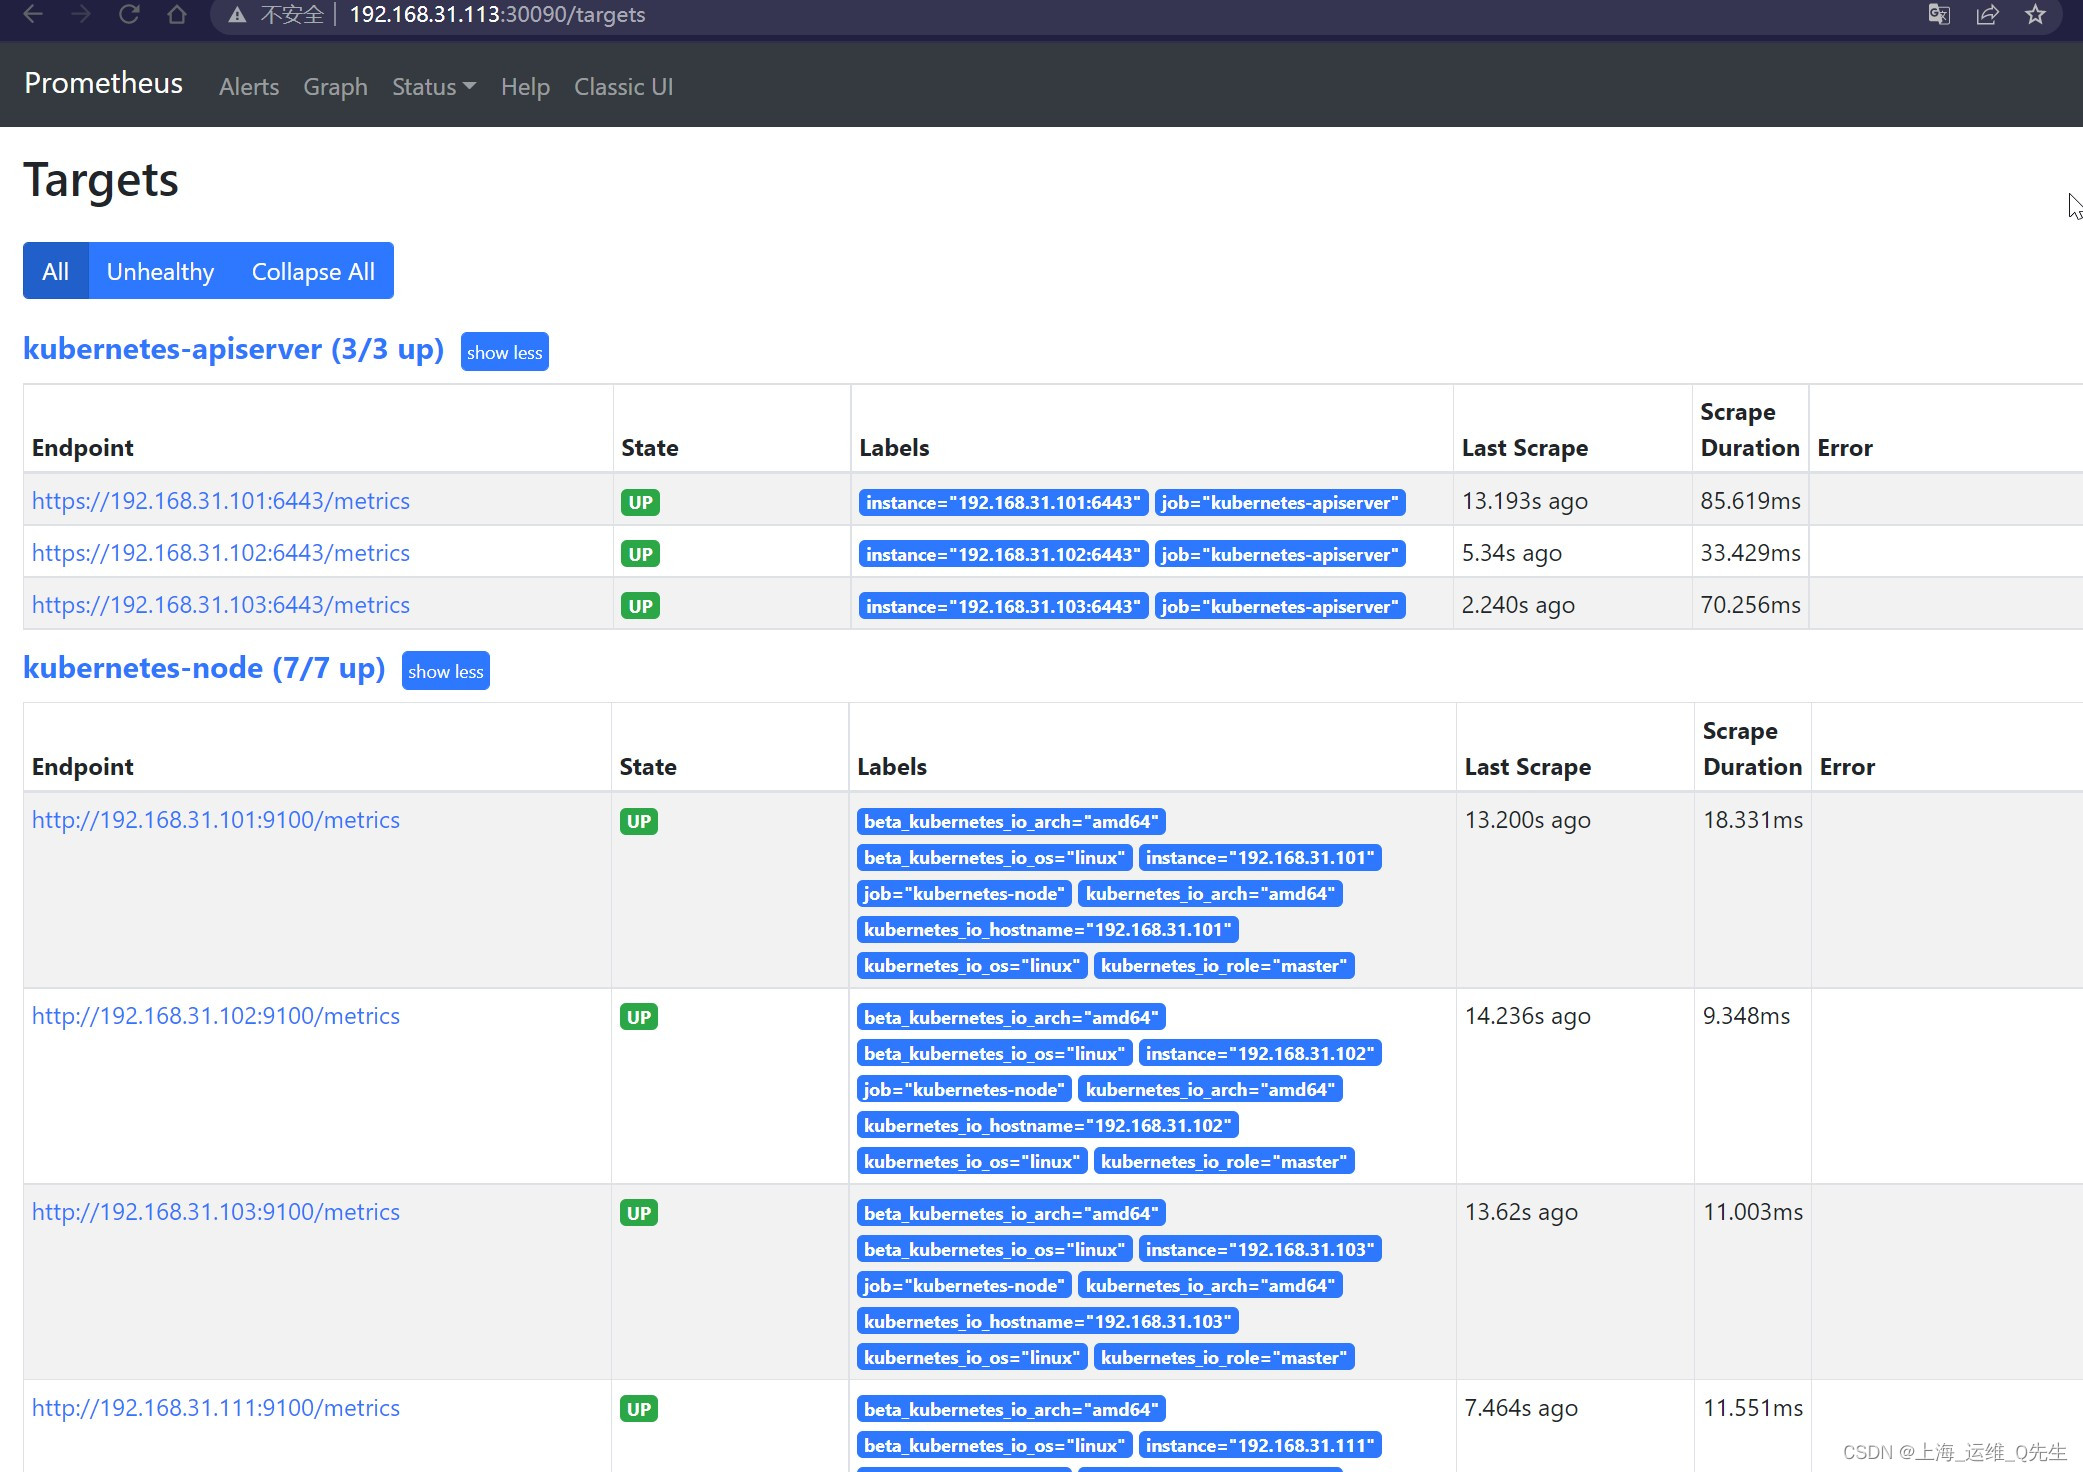
此时已经可以从svc提供的nodeport上访问到k8s采集到的数据
6. cAdvisor部署
cAdvisor不仅可以采集一台服务器上所有运行的容器信息,还提供基础查询界面和http接口,方便其他组件抓取数据.
https://github.com/google/cadvisor
6.1 cadvisor 镜像docker部署
VERSION=v0.36.0
sudo docker run \
  --volume=/:/rootfs:ro \
  --volume=/var/run:/var/run:ro \
  --volume=/sys:/sys:ro \
  --volume=/var/lib/docker/:/var/lib/docker:ro \
  --volume=/dev/disk/:/dev/disk:ro \
  --publish=8080:8080 \
  --detach=true \
  --name=cadvisor \
  --privileged \
  --device=/dev/kmsg \
  gcr.io/cadvisor/cadvisor:$VERSION
6.2 cAdvisor k8s中部署
apiVersion: apps/v1
kind: DaemonSet
metadata:
  name: cadvisor
  namespace: monitoring
spec:
  selector:
    matchLabels:
      app: cAdvisor
  template:
    metadata:
      labels:
        app: cAdvisor
    spec:
      tolerations:    #污点容忍,忽略master的NoSchedule
        - effect: NoSchedule
          key: node-role.kubernetes.io/master
      hostNetwork: true
      restartPolicy: Always   # 重启策略
      containers:
      - name: cadvisor
        image: harbor.intra.com/prometheus/cadvisor:v0.45.0
        imagePullPolicy: IfNotPresent  # 镜像策略
        ports:
        - containerPort: 8080
        volumeMounts:
          - name: root
            mountPath: /rootfs
          - name: run
            mountPath: /var/run
          - name: sys
            mountPath: /sys
          - name: docker
            mountPath: /var/lib/docker
      volumes:
      - name: root
        hostPath:
          path: /
      - name: run
        hostPath:
          path: /var/run
      - name: sys
        hostPath:
          path: /sys
      - name: docker
        hostPath:
          path: /var/lib/docker
部署cadvisor
root@k8s-master-01:/opt/k8s-data/yaml/prometheus-files/case1/prometheus-files/case# kubectl apply -f case1-daemonset-deploy-cadvisor.yaml
daemonset.apps/cadvisor created
root@k8s-master-01:/opt/k8s-data/yaml/prometheus-files/case1/prometheus-files/case# kubectl get pods -n monitoring
NAME                                 READY   STATUS    RESTARTS   AGE
cadvisor-5hgfg                       1/1     Running   0          7s
cadvisor-8f4dz                       1/1     Running   0          7s
cadvisor-8l7tx                       1/1     Running   0          7s
cadvisor-crnnf                       1/1     Running   0          7s
cadvisor-js4lx                       1/1     Running   0          7s
cadvisor-vznfs                       1/1     Running   0          7s
cadvisor-x2rlb                       1/1     Running   0          7s
node-exporter-4q2k9                  1/1     Running   0          46m
node-exporter-fn464                  1/1     Running   0          46m
node-exporter-fz5d5                  1/1     Running   0          46m
node-exporter-jd27l                  1/1     Running   0          46m
node-exporter-s8gdn                  1/1     Running   0          46m
node-exporter-sfsvj                  1/1     Running   0          46m
node-exporter-t5tlr                  1/1     Running   0          46m
prometheus-server-74c8d6675f-85d4t   1/1     Running   0          40m
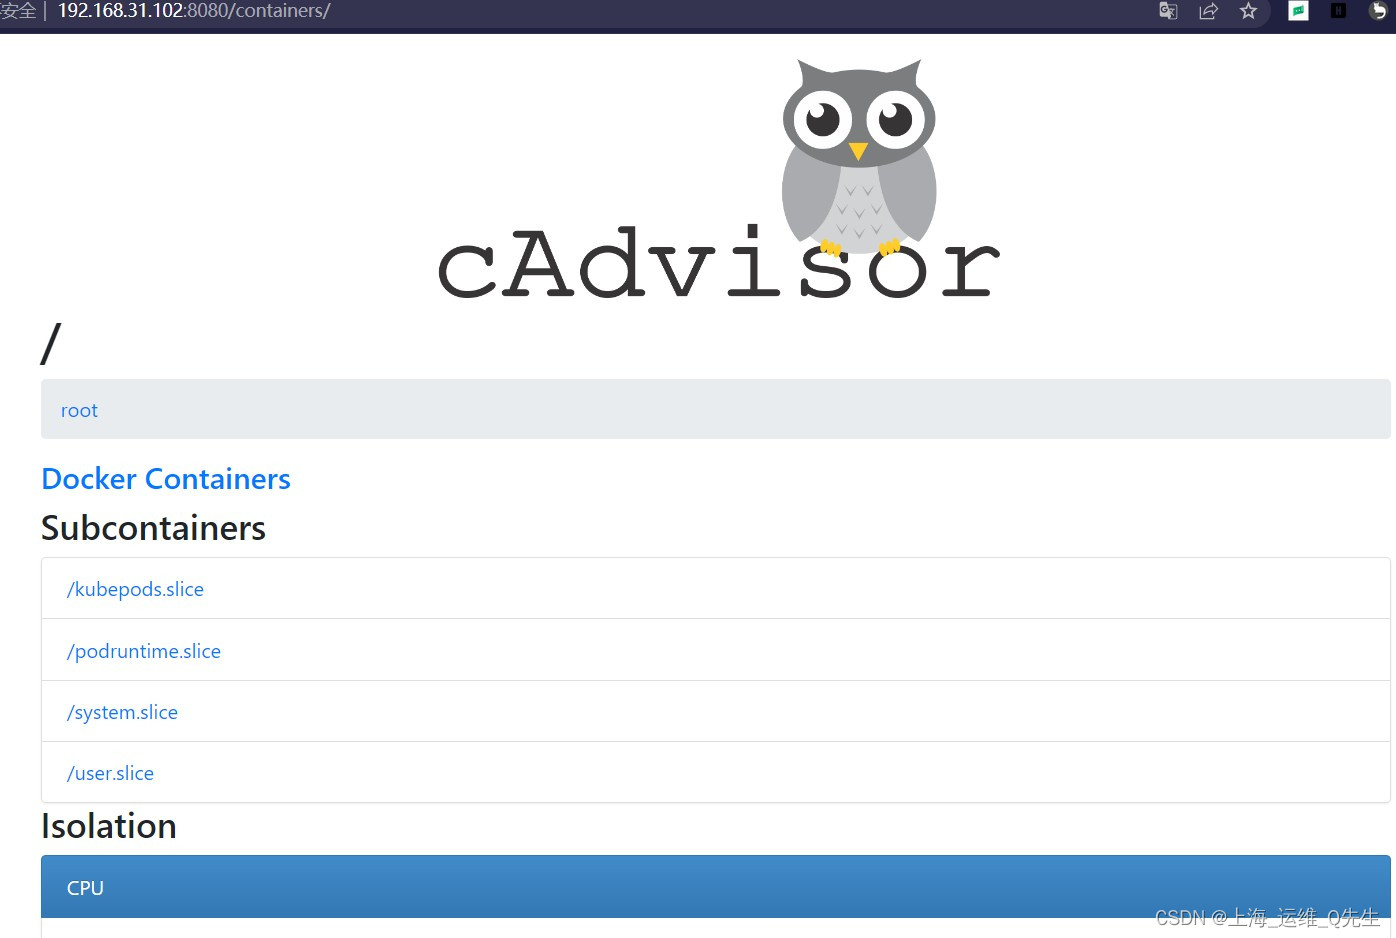
此时通过服务器的8080可以访问到cAdvisor的页面
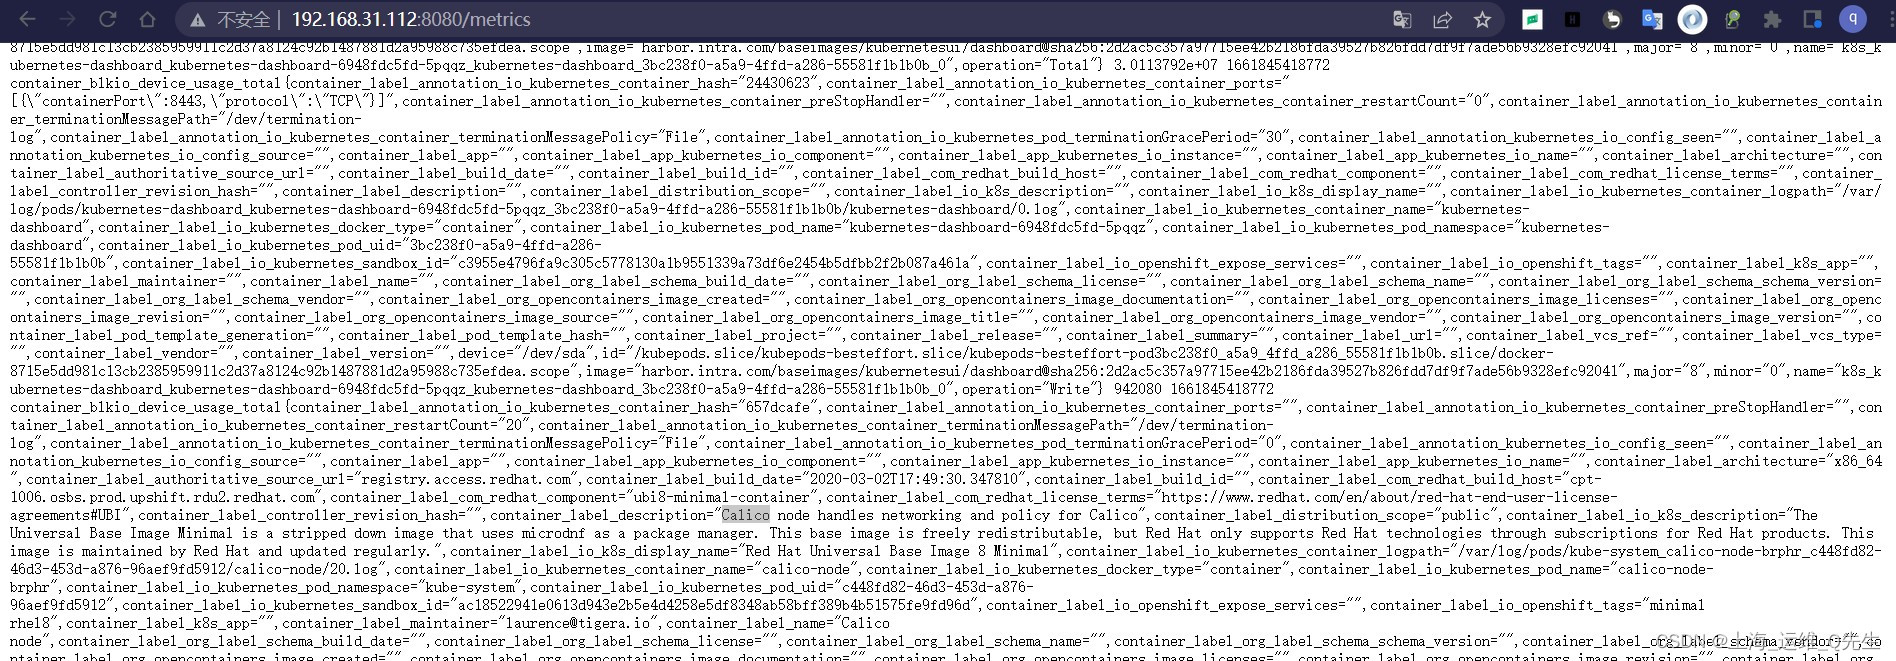
访问xxx:8080/metrics可以读取到采集的元数据
6.3 将cAdvisor采集的数据加入prometheus
6.3.1 二进prometheus配置
编辑/apps/prometheus/prometheus.yml
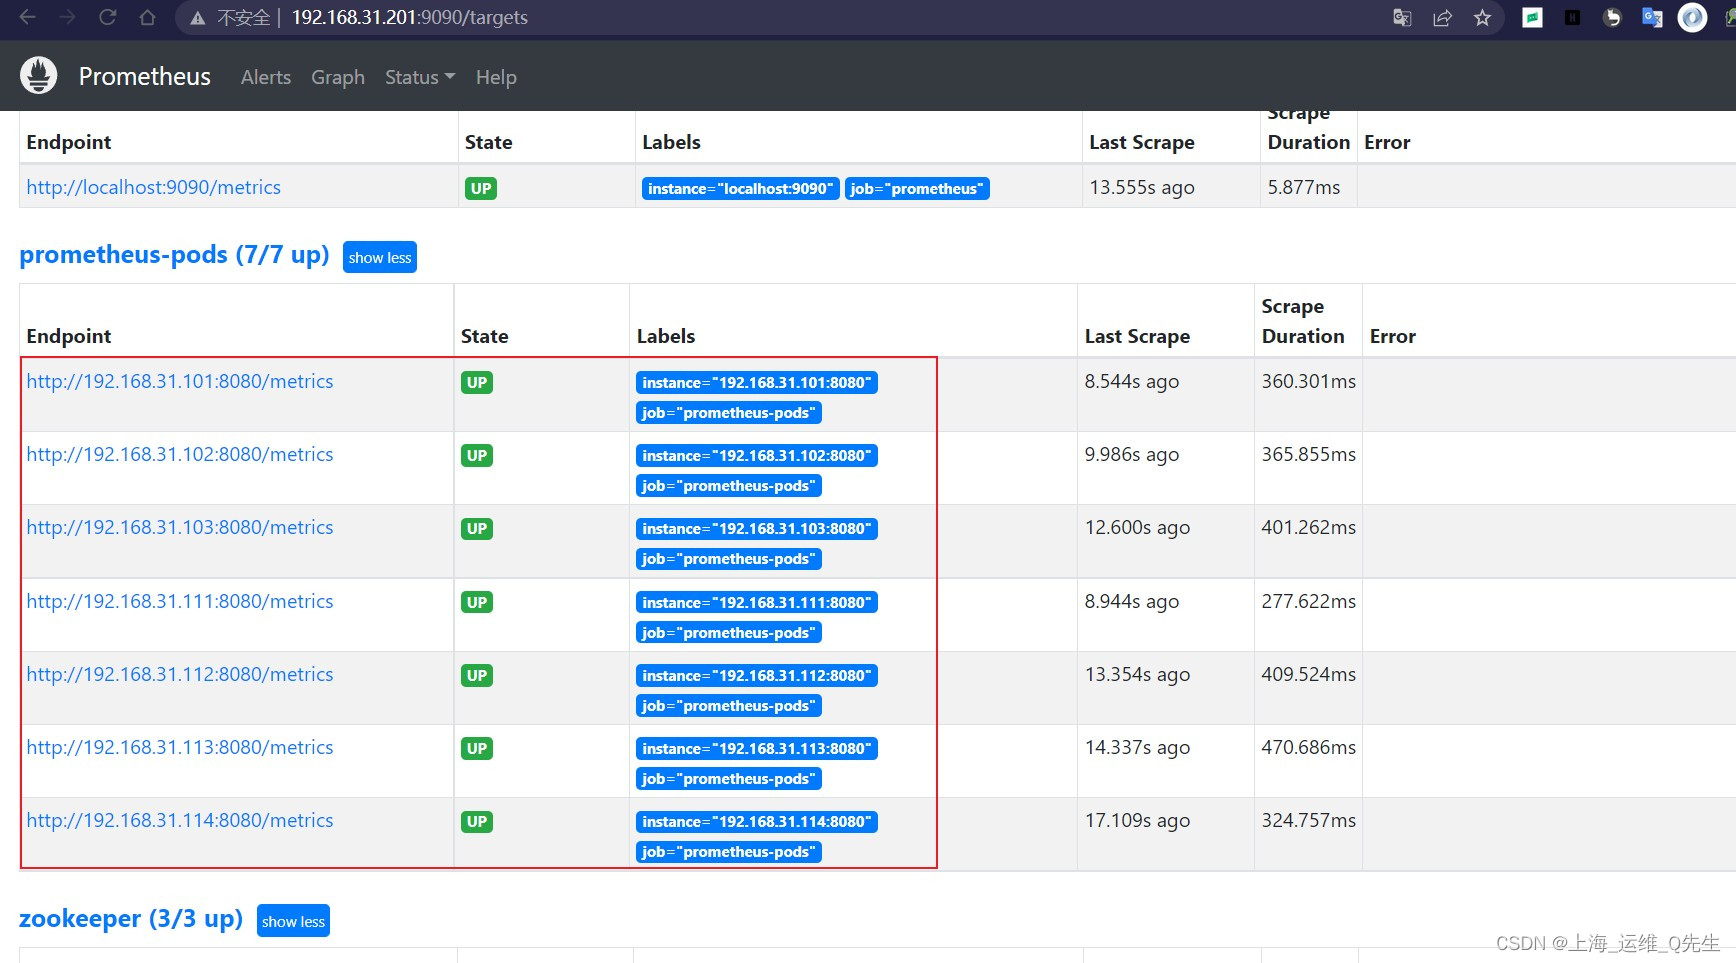
  - job_name: "prometheus-pods"
    static_configs:
      - targets: ["192.168.31.101:8080","192.168.31.102:8080","192.168.31.103:8080","192.168.31.111:8080","192.168.31.112:8080","192.168.31.113:8080","192.168.31.114:8080"]
重启服务
root@prometheus-2:/apps/prometheus# systemctl restart prometheus.service
重启之后就能在prometheus中看到k8s的pod数据
6.3.2 导入grafana
14282
6.4 将cAdvisor导入k8s prometheus
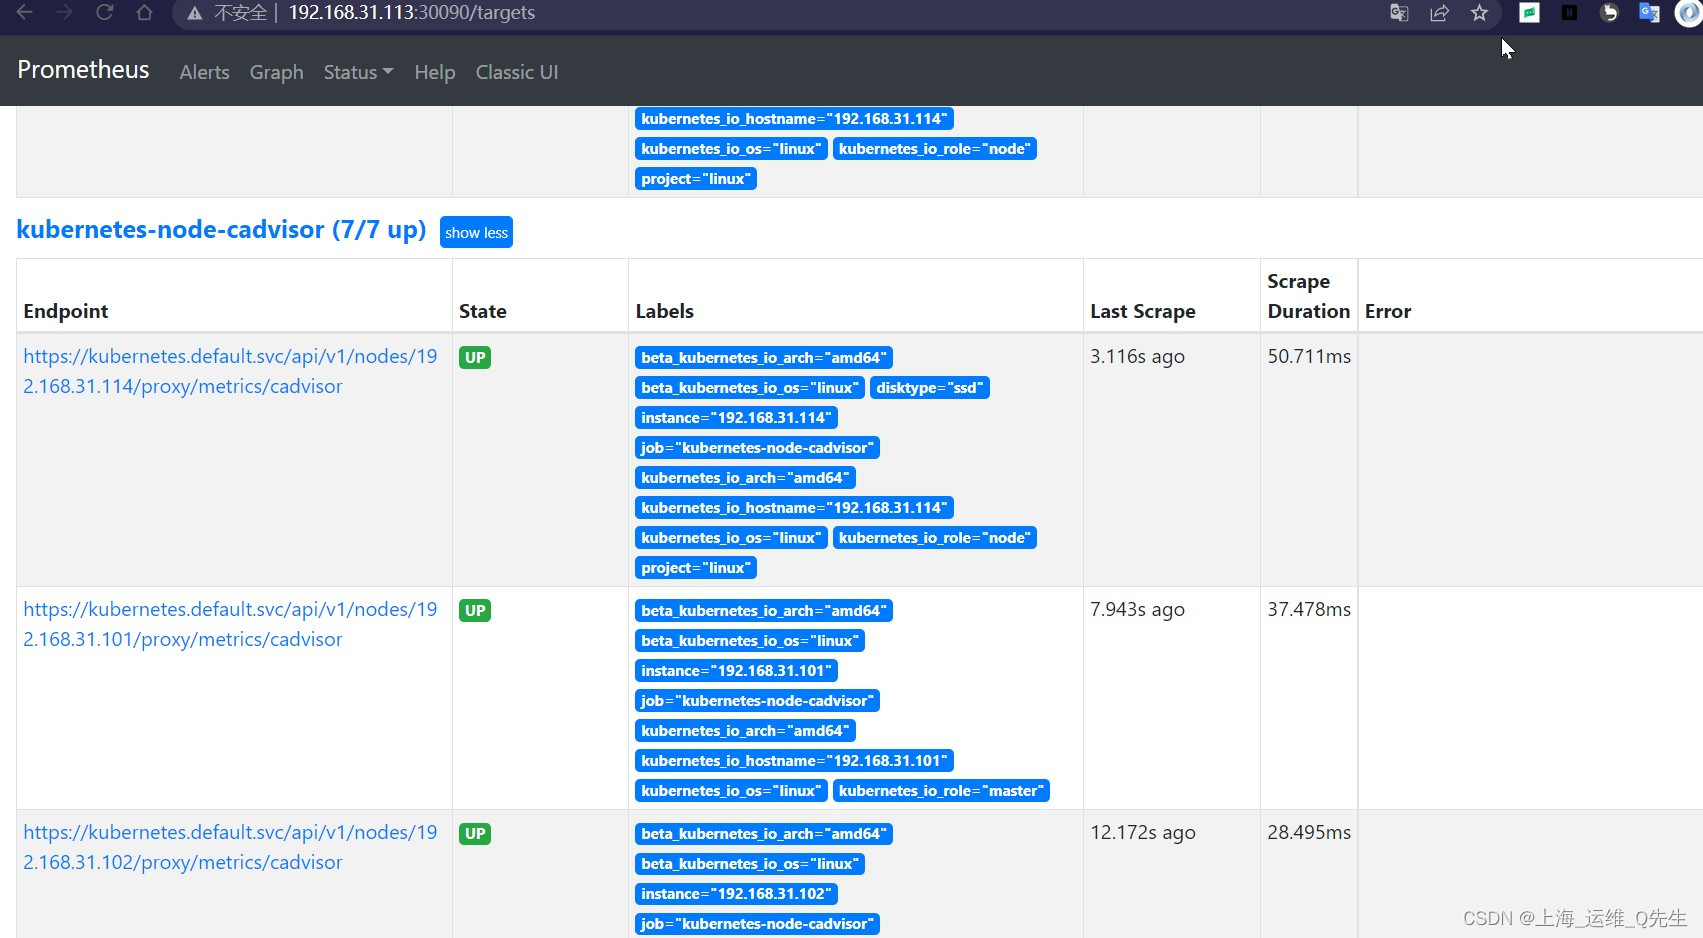
6.4.1 k8s prometheus配置
由于k8s的prometheus的configMap中配置了这段自动发现
    - job_name: 'kubernetes-node-cadvisor'
      kubernetes_sd_configs:
      - role:  node
      scheme: https
      tls_config:
        ca_file: /var/run/secrets/kubernetes.io/serviceaccount/ca.crt
      bearer_token_file: /var/run/secrets/kubernetes.io/serviceaccount/token
      relabel_configs:
      - action: labelmap
        regex: __meta_kubernetes_node_label_(.+)
      - target_label: __address__
        replacement: kubernetes.default.svc:443
      - source_labels: [__meta_kubernetes_node_name]
        regex: (.+)
        target_label: __metrics_path__
        replacement: /api/v1/nodes/${1}/proxy/metrics/cadvisor
在添加完cadvisor后prometheus中已经采集到了相关数据
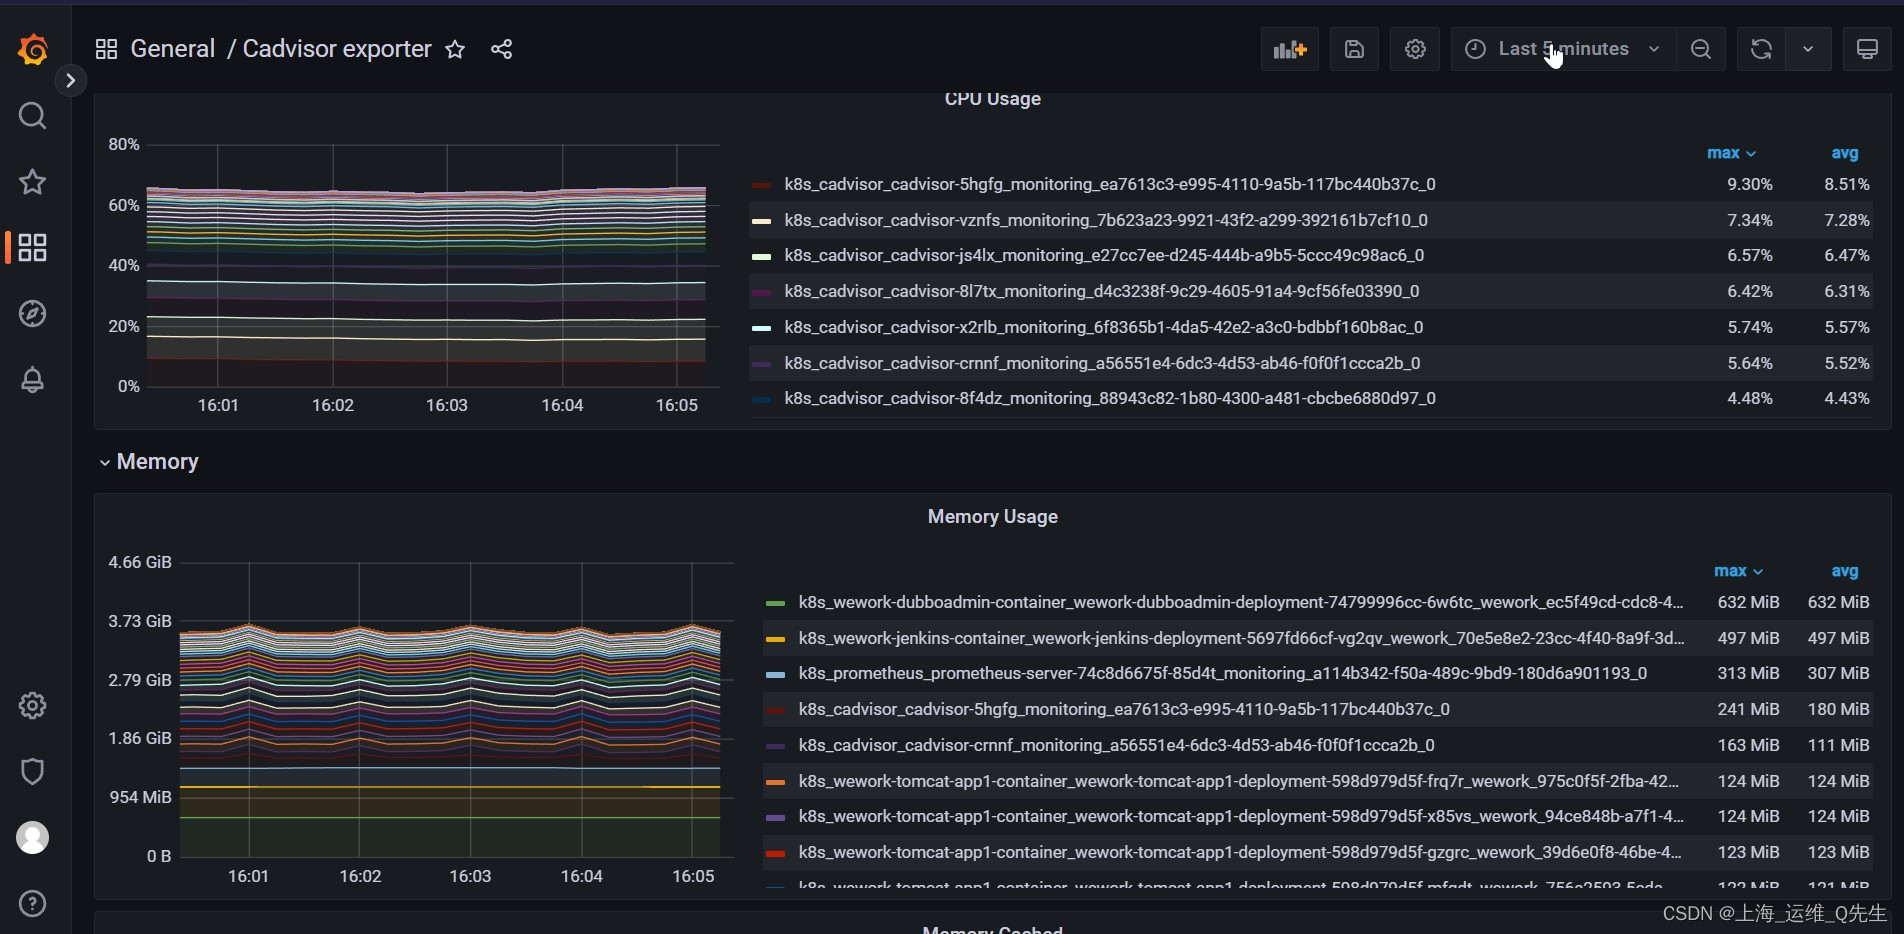
6.4.2 导入grafana
14282
