opencv调整图像亮度和对比度,以及opencv种的做法
1. 调整图像亮度和对比度
原理可以参考 opencv关于对比度和亮度的误解
通过设计一个映射曲线就可完成对比度、亮度调整,具体过程如上图所示,
(a) 为原图;
(b) 把亮度调高,像素强度+固定值;
© 把亮度调低,像素强度-固定值;
(d) 增大像素强度75附近的对比度;增大附近的斜率
(e) 增大像素强度150附近的对比度;
(f) 增大像素强度75和225附近的对比度。
曲线斜率大于45度角的区域灰度拉伸、精度上升、对比度变高;小于45度角的区域灰度被压缩、精度下降、对比度变低。
python实现的一个代码如下
首先减去均值,然后调整对比度,然后加上均值,最后调整亮度。
img_a = aa * (img - bri_mean) + bb + bri_mean
import cv2
import numpy as np
from matplotlib import pyplot as plt

if __name__ == "__main__":
    file = r'D:\dataset\data_gain1_2\cap_frame_0002_raw.png'
    img = cv2.imread(file).astype(np.float32)
    bri_mean = np.mean(img)

    a = np.arange(5, 16, 5) / 10
    b = np.arange(-30, 31, 30)

    a_len = len(a)
    b_len = len(b)
    print(a_len, b_len)
    plt.figure()

    for i in range(a_len):
        for j in range(b_len):
            aa = a[i]
            bb = b[j]
            img_a = aa * (img-bri_mean) + bb + bri_mean
            print(i, j, aa, bb)
            img_a = np.clip(img_a,0,255).astype(np.uint8)
            plt.subplot(a_len+1, b_len, (j + b_len * i + 1))
            plt.imshow(img_a, cmap='gray')
    plt.subplot(a_len + 1, b_len, a_len*b_len+1)
    plt.imshow(img.astype(np.uint8), cmap='gray')
    plt.show()
- 在opencv种有一个调节图像和对比度的方法
opencv demo code
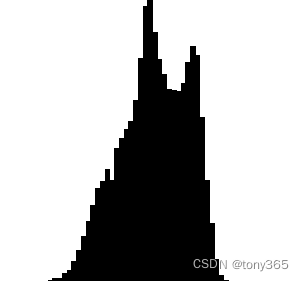
对应直方图的变化:
原图
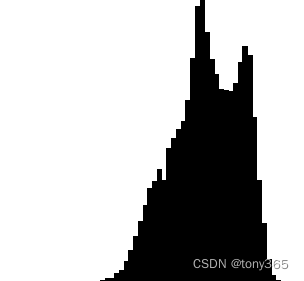
增加亮度,直方图向右平移
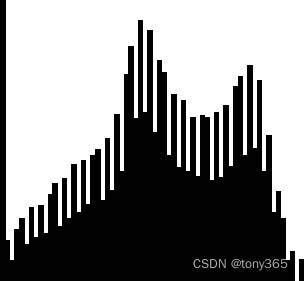
增加对比度, 直方图更加均衡
a. opencv方法:
if (contrast > 0)
    {
        delta = 127. * contrast / 100;
        a = 255. / (255. - delta * 2);
        b = a * (brightness - delta);
    }
    else
    {
        delta = -128. * contrast / 100;
        a = (256. - delta * 2) / 255.;
        b = a * brightness + delta;
    }
b. 按照下面公式的方法
img_a = aa * (img - bri_mean) + bb + bri_mean
bri_mean锚定为127的时候
    a = _contrast / 100.0f;
    b = (1 - a) * 127 + _brightness - 100;
通过对比直方图的变化效果 可知上面两个方法 作用是类似的。
本来想找opencv的方法链接,但是链接已经失效
完整demo:
#include "opencv2/core/utility.hpp"
#include "opencv2/imgproc.hpp"
#include "opencv2/imgcodecs.hpp"
#include "opencv2/highgui.hpp"

#include <iostream>

using namespace cv;
using namespace std;

int _brightness = 100;
int _contrast = 100;

Mat image;

/* brightness/contrast callback function */
static void updateBrightnessContrast(int /*arg*/, void*)
{
    int histSize = 64;
    int brightness = _brightness - 100;
    int contrast = _contrast - 100;

    /*
     * The algorithm is by Werner D. Streidt
     * (http://visca.com/ffactory/archives/5-99/msg00021.html)
     */
    double a, b;

    double delta=0;

    if (contrast > 0)
    {
        delta = 127. * contrast / 100;
        a = 255. / (255. - delta * 2);
        b = a * (brightness - delta);
    }
    else
    {
        delta = -128. * contrast / 100;
        a = (256. - delta * 2) / 255.;
        b = a * brightness + delta;
    }

    a = _contrast / 100.0f;
    b = (1 - a) * 127 + _brightness - 100;
    printf("ab value :%.4lf, %.4lf, %.4lf\n",delta, a, b);
    Mat dst, hist;
    image.convertTo(dst, CV_8U, a, b);
    imshow("image", dst);

    calcHist(&dst, 1, 0, Mat(), hist, 1, &histSize, 0);
    Mat histImage = Mat::ones(200, 320, CV_8U) * 255;

    normalize(hist, hist, 0, histImage.rows, NORM_MINMAX, CV_32F);

    histImage = Scalar::all(255);
    int binW = cvRound((double)histImage.cols / histSize);

    for (int i = 0; i < histSize; i++)
        rectangle(histImage, Point(i * binW, histImage.rows),
            Point((i + 1) * binW, histImage.rows - cvRound(hist.at<float>(i))),
            Scalar::all(0), -1, 8, 0);
    imshow("histogram", histImage);
}

const char* keys =
{
    "{help h||}{@image|baboon.jpg|input image file}"
};

int main(int argc, const char** argv)
{
    CommandLineParser parser(argc, argv, keys);
    parser.about("\nThis program demonstrates the use of calcHist() -- histogram creation.\n");
    if (parser.has("help"))
    {
        parser.printMessage();
        return 0;
    }
    string inputImage = parser.get<string>(0);
    // Load the source image. HighGUI use.
    image = imread(samples::findFile(inputImage), IMREAD_GRAYSCALE);
    if (image.empty())
    {
        std::cerr << "Cannot read image file: " << inputImage << std::endl;
        return -1;
    }

    namedWindow("image", 0);
    namedWindow("histogram", 0);

    createTrackbar("brightness", "image", &_brightness, 200, updateBrightnessContrast);
    createTrackbar("contrast", "image", &_contrast, 200, updateBrightnessContrast);

    updateBrightnessContrast(0, 0);
    waitKey();

    return 0;
}