GTOT-Toolkit模板参考
在执行main_drawResult.m,main_drawTrackersResult.m,main_attrDrawCurve.m之前需要进行一些代码路径的修改:
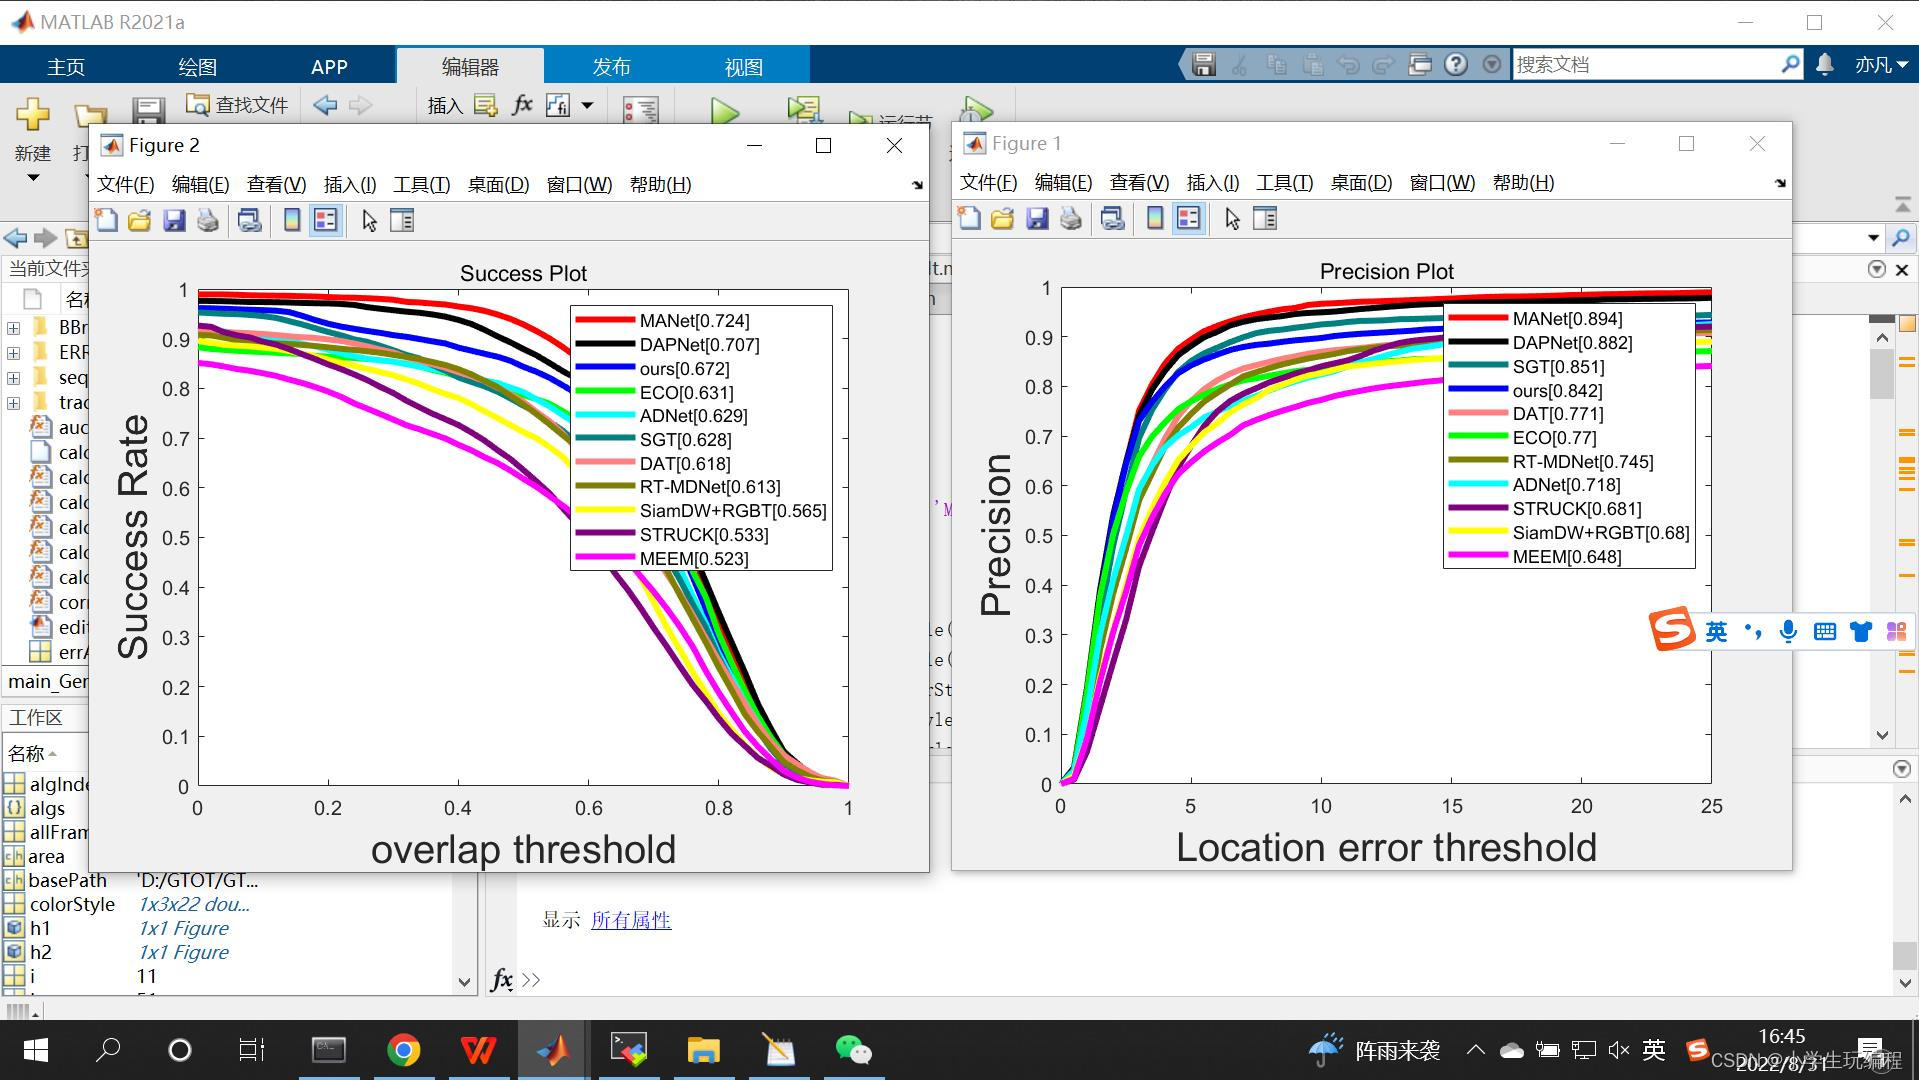
下面是main_drawResult.m图像(结果对比图):
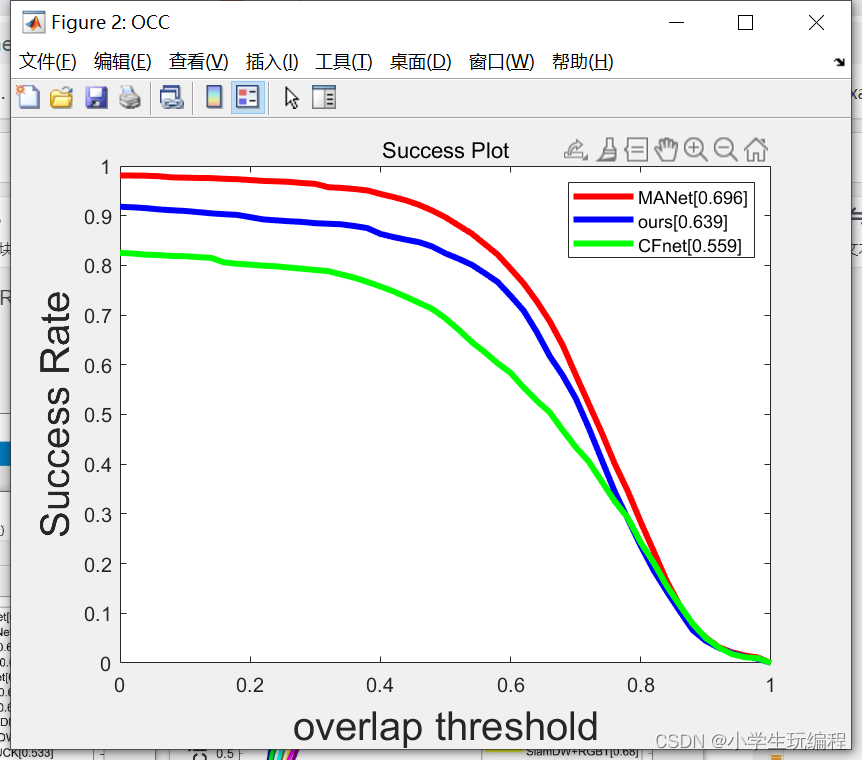
下面是main_attrDrawCurve.m图像(各个挑战的图像):
下面是main_attrDrawCurve.m图像:
①main_GenerateMat.m:
clear all;
close all;
clc;
basePath='D:/GTOT/GTOT/';           %填你本地GTOT数据集的路径

sequences=dir(basePath);
sequences={sequences.name};
sequences=sequences(3:end);
%trackers={'SGT','MDNet+RGBT','CN','KCF','CSK','ours','SCM','Struck'};   %可以选择将什么算法以图象展现出来
trackers={'ours'};

bPlot=1;
calcPlotErr(sequences, trackers,  bPlot);
②calcPlotErr.m:
function [aveErrCoverageAll aveErrCenterAll] = calcPlotErr(seqs, trks, bPlot)
basePath='D:/GTOT/GTOT/'; %填你本地GTOT数据集的路径
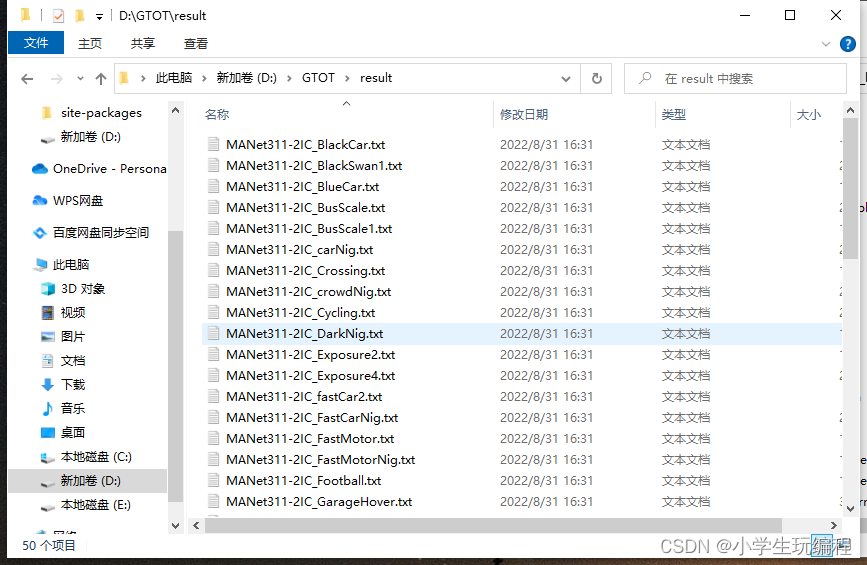
resultPath='D:/GTOT/result/'; %追踪算法得到的txt文件所存的路径
LineWidth = 2;
LineStyle = '-';%':';%':' '.-'
% Curvature = [0,0];
% path_anno = '.\anno\';
lostCount = zeros(length(seqs), length(trks));
thred = 0.33;
% lostRate = zeros(length(seqs), length(trks));
% lostRateEachAlg = zeros(1, length(trks));
errCenterAll=[];
errCoverageAll=[];
lenTotalSeqV = 0;
lenTotalSeqI = 0;
precisonPlot=0;
successPlot=0;
rectMat=[];
for index_seq=1:length(seqs)
seq = seqs{index_seq}
% seq_name = seq.name
seq_name=seq;
fileNameV = [basePath seq_name '/groundTruth_v.txt'];
fileNameI = [basePath seq_name '/groundTruth_i.txt'];
% fileName
rect_annoV = dlmread(fileNameV);
rect_annoI = dlmread(fileNameI);
% seq_length = seq.endFrame-seq.startFrame+1; %size(rect_anno,1);
% lenTotalSeq = lenTotalSeq + seq_length;
seq_lengthV=size(rect_annoV,1);
seq_lengthI=size(rect_annoI,1);
lenTotalSeqV = lenTotalSeqV + seq_lengthV;
lenTotalSeqI = lenTotalSeqI + seq_lengthI;
centerGTV = [(rect_annoV(:,1)+rect_annoV(:,3))/2 (rect_annoV(:,2)+rect_annoV(:,4))/2];
centerGTI = [(rect_annoI(:,1)+rect_annoI(:,3))/2 (rect_annoI(:,2)+rect_annoI(:,4))/2];
rect_whV=[rect_annoV(:,1),rect_annoV(:,2),rect_annoV(:,3)-rect_annoV(:,1),rect_annoV(:,4)-rect_annoV(:,2)];% x y w h
rect_whI=[rect_annoI(:,1),rect_annoI(:,2),rect_annoI(:,3)-rect_annoI(:,1),rect_annoI(:,4)-rect_annoI(:,2)];
% rect=[];
% indexLost = zeros(length(trks), seq_length);
% if bPlot
% clf
% end
for index_algrm=1:length(trks)
algrm = trks{index_algrm};
% name=algrm.name;
name=algrm;
trackerNames{index_algrm}=name;
% res_path = [pathRes seq_name '_' name '/'];
% fileName = [pathRes seq_name '_' name '.mat'];
% load(fileName);
% [basePath seq_name '\' name '_result.txt']
% results.res=dlmread([basePath seq_name '\' name '_result.txt']);
results.res=dlmread([resultPath 'MANet311-2IC_' seq_name '.txt']); %第二个参数填你的算法名字
results.type='4corner';
rectMat = zeros(seq_lengthV, 4);
switch results.type
case 'rect'
rectMat = results.res;
case 'ivtAff'
for i = 1:seq_lengthV
[rect c] = calcRectCenter(results.tmplsize, results.res(i,:), 'Color', [1 1 1], 'LineWidth', LineWidth,'LineStyle',LineStyle);
rectMat(i,:) = rect;
% center(i,:) = c;
end
case 'L1Aff'
for i = 1:seq_lengthV
[rect c] = calcCenter_L1(results.res(i,:), results.tmplsize);
rectMat(i,:) = rect;
end
case 'LK_Aff'
for i = 1:seq_lengthV
[corner c] = getLKcorner(results.res(2*i-1:2*i,:), results.tmplsize);
rectMat(i,:) = corner2rect(corner);
end
case '4corner'
for i = 1:seq_lengthV
% rectMat(i,:) = corner2rect(results.res(2*i-1:2*i,:));
rectMat(i,:) = corner2rect(results.res(i,:));
end
otherwise
continue;
end
center = [rectMat(:,1)+(rectMat(:,3))/2 rectMat(:,2)+(rectMat(:,4))/2];
% rectMat(1,3)
% center(1,:)
% centerGT(1,:)
% size(center)
% center(1:seq_length,:)
% size((centerGT(1:seq_length,:)))
errV = calcRectInt(rectMat(1:seq_lengthV,:),rect_whV(1:seq_lengthV,:));
errI = calcRectInt(rectMat(1:seq_lengthI,:),rect_whI(1:seq_lengthI,:));
err = max(errV, errI);
% err(:,index_algrm) = errV(:,index_algrm);
% err = (max(errV, errI)+min(errV, errI))/2;
% rectMat(1,:)
% rect_anno(1,:)
% err(1,1)
errCenterV = sqrt(sum(((center(1:seq_lengthV,:) - centerGTV(1:seq_lengthV,:)).^2),2));
errCenterI = sqrt(sum(((center(1:seq_lengthI,:) - centerGTI(1:seq_lengthI,:)).^2),2));
errCenter = min(errCenterV, errCenterI);
% errCenter(:,index_algrm) = errCenterV(:,index_algrm);
% errCenter = (max(errCenterV, errCenterI)+min(errCenterV, errCenterI))/2;
% errCenter(100,1)
if(isdir(['ERRresults/' name])==0),
mkdir(['ERRresults/' name]);
end
save([['ERRresults/' name] '/' name '_' seq_name '.mat'], 'err','errCenter');
if bPlot
h1=figure(1);
% h1=figure(index_algrm*2-1);
% plot(err(:,index_algrm),'color', trks{index_algrm}.color,'LineWidth',LineWidth,'LineStyle',LineStyle);
plot(err,'color',[0,1,0],'LineWidth',LineWidth,'LineStyle',LineStyle);
hold on
h2=figure(2);
% h2=figure(index_algrm*2);
plot(errCenter,'color', [0,1,0],'LineWidth',LineWidth,'LineStyle',LineStyle);
hold on
end
end
if bPlot
figure(1);
% figure(index_algrm*2-1);
axis tight
set(gca,'fontsize',20);
% xlabel(h1,'string',['# ' seqs{index_seq}],'FontSize',20)
% ylabel(h1,'string','Coverage/quality','FontSize',20)
xlabel(['# ' seqs{index_seq}],'FontSize',20)
ylabel('Coverage/quality','FontSize',20)
% legend(trackerNames,'Orientation','horizontal','Position', [0.20 0.004 0.59 0.05]);
% legend(trackerNames,'Position', 'Best');
% print(h1, '-depsc', [pathPlot seq_name '_coverage']);
% imwrite(frame2im(getframe(h1)), [pathPlot seq_name '_coverage.png']);
figure(2);
% figure(index_algrm*2);
axis tight;
set(gca,'fontsize',20);
% xlabel(h2,'string',['# ' seqs{index_seq}],'FontSize',20)
% ylabel(h2,'string','Center error','FontSize',20)
xlabel(['# ' seqs{index_seq}],'FontSize',20)
ylabel('Center error','FontSize',20)
% legend(trackerNames,'Position', 'Best');
% print(h2, '-depsc', [pathPlot seq_name '_center']);
% imwrite(frame2im(getframe(h2)), [pathPlot seq_name '_center.png']);
pause(0.05);
clf(h1);
clf(h2);
end
aveErrCoverage(index_seq,:) = sum(err)/seq_lengthV;
errCoverageAll(index_seq,:) = sum(err);
aveErrCenter(index_seq,:) = sum(errCenter)/seq_lengthV;
errCenterAll(index_seq,:) = sum(errCenter);
lostCount(index_seq,:)=sum(err<thred);
precisonPlot=precisonPlot+sum(errCenter<=5);
successPlot=successPlot+sum(err>0.6);
err = [];
errV = [];
errI = [];
errCenter=[];
errCenterV = [];
errCenterI = [];
end
close(h1);
close(h2);
% lenTotalSeq
% aveErrCoverageAll=sum(errCoverageAll)/lenTotalSeq;
% aveErrCenterAll=sum(errCenterAll)/lenTotalSeq;
% precisonPlot
% precisonPlot/lenTotalSeq
% successPlot/lenTotalSeq
% save(['./errAnalysis.mat'], 'aveErrCoverage', 'aveErrCenter', 'aveErrCoverageAll', 'aveErrCenterAll', 'lostCount', 'thred');
% lostRateEachAlg=sum(lostCount)/lenTotalSeq
% lostCount
% sum(lostCount)
这是MANet跑出来的结果和所在路径:
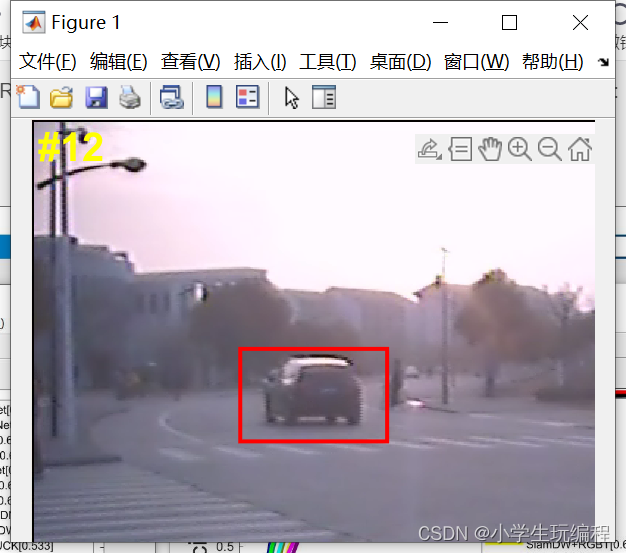
跑main_drawTrackersResult.m:
clc;
close all;
clear all;

%tracker={'WJSR'};%,'STRUCK','CN','CT','MIL','SCM'};%,'STC','CSK','SemiB' };
%tracker={'Ours','SGT','Struck','SCM','JSR','KCF','L1-PF'}

%tracker={'PaGLe','Struck','CN','JSR','KCF','SCM','L1-PF'};%,'STC','CSK','SemiB' };
%tracker={'Ours'}
tracker={'Struck'}     %追踪器的名字
basePath='D:/GTOT/GTOT/';            %数据集路径
dirs = dir(basePath);
sequences = {dirs.name};
sequences(strcmp('.', sequences) | strcmp('..', sequences) | ...
	strcmp('anno', sequences) | ~[dirs.isdir]) = [];
sequence='Blackcar';            %填你需要测试的序列名
%for ni=8
% sequence=sequences{ni}
trackerResultsPath='BBresults/';
sequencePath='D:/GTOT/GTOT/';;      %数据集路径
saveBasePath='trackingResultsDisplay/';                 %结果保存位置
if(isdir(saveBasePath)==0),
    mkdir(saveBasePath);
end


savingPath=[saveBasePath sequence '/'];
if(isdir(savingPath)==0),
    mkdir(savingPath);
    mkdir([savingPath 'v/']);
    mkdir([savingPath 'i/']);

end
savingPath


edgeColor={'r','g','b','y','k','m','c','g','b'};
lineStyle={'-','-','-','-','-','-','-','-',':',':'};
for trackerIndex=1:length(tracker),
    if (isempty(strfind(tracker{trackerIndex},'_v'))==1)&&(isempty(strfind(tracker{trackerIndex},'_i'))==1),
         trackerResult(:,:,trackerIndex)=dlmread([trackerResultsPath tracker{trackerIndex} '_' sequence '.txt']);

    else
        if isempty(strfind(tracker{trackerIndex},'_v'))==1,
            trackerName=tracker{trackerIndex}(1:strfind(tracker{trackerIndex},'_i')-1);

            trackerResult(:,:,trackerIndex)=dlmread([trackerResultsPath trackerName '_' sequence '_i.txt']);
        else

            trackerName=tracker{trackerIndex}(1:strfind(tracker{trackerIndex},'_v')-1);
            trackerName
            trackerResult(:,:,trackerIndex)=dlmread([trackerResultsPath trackerName '_' sequence '_v.txt']);
        end

    end

end

frames_v=dir([sequencePath sequence '/v/*.png']);
frames_i=dir([sequencePath sequence '/i/*.png']);
if(isempty(frames_v)==1),
    frames_v=dir([sequencePath sequence '/v/*.bmp']);
end

if(isempty(frames_i)==1),
    frames_i=dir([sequencePath sequence '/i/*.bmp']);
end

frames_v={frames_v.name};
frames_i={frames_i.name};
 bb=[trackerResult(:,1,:),  trackerResult(:,2,:) , trackerResult(:,5,:)-trackerResult(:,1,:),trackerResult(:,6,:)-trackerResult(:,2,:)]   ;

for frameIndex=1:length(frames_v),
    im=imread([sequencePath sequence '/v/' frames_v{frameIndex}]);
    imshow(uint8(im));
    for trackerIndex=1:length(tracker),
         if ~isempty(strfind(tracker{trackerIndex},'_i'))==1,
            continue;
        end
       rectangle('Position',bb(frameIndex,:,trackerIndex),'LineWidth',2,'EdgeColor',edgeColor{trackerIndex},'LineStyle',lineStyle{trackerIndex});
    end
        hold on;
        text(5, 18, strcat('#',num2str(frameIndex)), 'Color','y', 'FontWeight','bold', 'FontSize',20);
        set(gca,'position',[0 0 1 1]);
        pause(0.00001);
        hold off;
        imwrite(frame2im(getframe(gcf)),[savingPath 'v/'  num2str(frameIndex) '.jpg']);
%       bb=[trackerResult(frameIndex,1,1),  trackerResult(frameIndex,2,1) , trackerResult(frameIndex,5,1)-trackerResult(frameIndex,1,1),trackerResult(frameIndex,6,1)-trackerResult(frameIndex,2,1)]
%      rectangle('Position', bb,'EdgeColor','r','LineWidth',5);
%     hold off;

end


for frameIndex=1:length(frames_v),
    im=imread([sequencePath sequence '/i/' frames_i{frameIndex}]);
    imshow(uint8(im));
    for trackerIndex=1:length(tracker),
        if ~isempty(strfind(tracker{trackerIndex},'_v'))==1,
            continue;
        end

       rectangle('Position',bb(frameIndex,:,trackerIndex),'LineWidth',2,'EdgeColor',edgeColor{trackerIndex},'LineStyle',lineStyle{trackerIndex});
    end
        hold on;
        text(5, 18, strcat('#',num2str(frameIndex)), 'Color','y', 'FontWeight','bold', 'FontSize',20);
        set(gca,'position',[0 0 1 1]);
        pause(0.00001);
        hold off;
        imwrite(frame2im(getframe(gcf)),[savingPath 'i/'  num2str(frameIndex) '.jpg']);
%       bb=[trackerResult(frameIndex,1,1),  trackerResult(frameIndex,2,1) , trackerResult(frameIndex,5,1)-trackerResult(frameIndex,1,1),trackerResult(frameIndex,6,1)-trackerResult(frameIndex,2,1)]
%      rectangle('Position', bb,'EdgeColor','r','LineWidth',5);
%     hold off;

end
clear trackerResult;
%end
跑main_attrDrawCurve.m:
%针对属性OCC	LSV	FM	LI	HI	TC	LR	DEF 画相应的precision和success曲线
close all;
clear all;
clc;
pixelThreshold=5;

attrMat='./sequencesAttr/AttrMat.mat';%属性保存的mat

basePath='D:/GTOT/GTOT/';           %数据集路径
resultMatPath='ERRresults\';
attrDisplay='OCC';                 %画某种属性的曲线  OCC LSV	FM	LI		TC	SO	DEF All
% algs={'SCM','SCM_i','SCM_v','STRUCK','STRUCK_i','STRUCK_v','CN','STC','CSK','CT','CN_i',...
%     'CN_v','STC_v','STC_i','CSK_v','CSK_i','CT_v','CT_i'...
%     };
algs={'CFnet','MANet','ours'};         %需要画出的算法
%algs={'MACoR','SCM','STRUCK','CSK','STC','CN','CT','MIL','TLD'};
%   algs={'SCM_i','STRUCK_i','CSK_i','STC_i','CN_i','CT_i','MUSter_i','MEEM_i','PCOM_i','MIL_i','TLD_i','RPT_i'};
%   algs={'SCM_v','STRUCK_v','CSK_v','STC_v','CN_v','CT_v','MUSter_v','MEEM_v','PCOM_v','MIL_v','TLD_v','RPT_v'};


attrs=load(attrMat);
colorStyle(:,:,1)=[1,0,0];colorStyle(:,:,2)=[0,0,1];colorStyle(:,:,3)=[0,1,0];colorStyle(:,:,4)=[0,1,1];colorStyle(:,:,5)=[1,0,1];
colorStyle(:,:,6)=[1,0,0];colorStyle(:,:,7)=[0,0,1];colorStyle(:,:,8)=[0,1,0];colorStyle(:,:,9)=[0,1,1];colorStyle(:,:,10)=[1,0,1];
colorStyle(:,:,11)=[1,0.5,0];colorStyle(:,:,12)=[0,0.5,1];colorStyle(:,:,13)=[0,1,0.5];colorStyle(:,:,14)=[0.5,1,1];colorStyle(:,:,15)=[1,0.5,1];
colorStyle(:,:,16)=[0.5,0,0];colorStyle(:,:,17)=[0,0,0.5];colorStyle(:,:,18)=[0,0.5,0];colorStyle(:,:,19)=[0,0.5,0.5];colorStyle(:,:,20)=[0.5,0,0.5];
lineStyle(:,:,1:8)='-';
lineStyle(:,:,9:16)=':';
sequencesAll=dir(basePath);
sequencesAll={sequencesAll.name};
sequencesAll=sequencesAll(3:end);


sequences={};
if strcmp(attrDisplay,'ALL')==1,
    sequences=sequencesAll;
else

    jjj=0;
for seqIndex=1:length(sequencesAll),

     idx=find(strcmp(attrs.seqName, sequencesAll{seqIndex})==1);%找到这个序列在mat中的下标
     switch attrDisplay,
         case 'OCC';
             if attrs.OCC(idx)==1,
                 sequences{end+1}=sequencesAll{seqIndex};
             end

         case 'LSV';
             if attrs.LSV(idx)==1,
                 sequences{end+1}=sequencesAll{seqIndex};
             end
         case 'FM';
             if attrs.FM(idx)==1,
                 sequences{end+1}=sequencesAll{seqIndex};
             end
         case 'LI';
             if attrs.LI(idx)==1,
                 sequences{end+1}=sequencesAll{seqIndex};
             end
         case 'HI';
             if attrs.HI(idx)==1,
                 sequences{end+1}=sequencesAll{seqIndex};
             end
         case 'TC';
             if attrs.TC(idx)==1,
                 sequences{end+1}=sequencesAll{seqIndex};
             end
         case 'SO';
             if attrs.SO(idx)==1,
                 sequences{end+1}=sequencesAll{seqIndex};
             end
         case 'DEF';
             if attrs.DEF(idx)==1,
                 sequences{end+1}=sequencesAll{seqIndex};
             end


     end


end
end

sequences
disp([attrDisplay 'seqNum:'  int2str(length(sequences))]);


precisionX=[0:0.5:25];
successX=[0:0.02:1];
% precisionY=zeros(size(precisionX));
precisionY=zeros([size(precisionX,2) size(algs,2)]);
% successY=zeros(size(successX));
successY=zeros([size(successX,2) size(algs,2)]);
allFramesNum=0;

for algIndex=1:size(algs,2),
for seqIndex=1:size(sequences,2),
%     ['results/' algs{1} '/' algs{1} '_' sequencesAll{i} '.mat']
    results(seqIndex)=load([resultMatPath algs{algIndex} '/' algs{algIndex} '_' sequences{seqIndex} '.mat']);
    allFramesNum=allFramesNum+size(results(seqIndex).err,1);
    for j=1:size(successX,2),
    precisionY(j,algIndex)=precisionY(j,algIndex)+sum(results(seqIndex).errCenter<precisionX(j));
    successY(j,algIndex)=successY(j,algIndex)+sum(results(seqIndex).err>successX(j));
    end


end
end


disp([attrDisplay 'FrameNum:' int2str(allFramesNum/length(algs))]);
allFramesNum=allFramesNum/size(algs,2);
%sort


%.................................................................................
%precision Plot
%.................................................................................
 precisionthr(1:size(algs,2))=precisionY(2*pixelThreshold+1,1:size(algs,2))/allFramesNum;

 [~,precisionIndex]=sort(precisionthr,'descend');

h1=figure('Name',attrDisplay)
for trackerIndex=1:size(algs,2),

 plot(precisionX,precisionY(:,precisionIndex(trackerIndex))'/allFramesNum,'color',colorStyle(:,:,trackerIndex),'LineWidth',3,'LineStyle',lineStyle(:,:,trackerIndex));
 hold on
 precision=num2str(precisionY(2*pixelThreshold+1,precisionIndex(trackerIndex))/allFramesNum,3);
 legendLabel{trackerIndex}=[algs{precisionIndex(trackerIndex)} '[' precision ']'];
end


title('Precision Plot');
xlabel( 'Location error threshold','FontSize',20)
ylabel('Precision','FontSize',20)
legend(legendLabel);

%.................................................................................
%success Plot
%.................................................................................
for i=1:size(algs,2),
successthr(i)=auc(successX,successY(:,i)'/allFramesNum);
end

[~,successIndex]=sort(successthr,'descend');
h2=figure('Name',attrDisplay)
for trackerIndex=1:size(algs,2),
plot(successX,successY(:,successIndex(trackerIndex))'/allFramesNum,'color',colorStyle(:,:,trackerIndex),'LineWidth',3,'LineStyle',lineStyle(:,:,trackerIndex));
hold on
area=num2str(auc(successX,successY(:,successIndex(trackerIndex))'/allFramesNum),3);
legendLabel1{trackerIndex}=[algs{successIndex(trackerIndex)} '[' area ']'];
end
title('Success Plot');
xlabel( 'overlap threshold','FontSize',20)
ylabel('Success Rate','FontSize',20)
legend(legendLabel1);
③画main_drawResult.m:
close all;
clear all;
clc;
algs={'MANet','ours','ECO','ADNet','MEEM','SiamDW+RGBT','DAPNet','RT-MDNet','DAT','STRUCK','SGT'}   %要画的tracker
%algs={'ours'};
pixelThreshold=5;

colorStyle(:,:,1)=[1,0,0];colorStyle(:,:,2)=[0,0,1];colorStyle(:,:,3)=[0,1,0];colorStyle(:,:,4)=[0,1,1];
colorStyle(:,:,5)=[1,0,1];colorStyle(:,:,6)=[1,1,0];colorStyle(:,:,7)=[0,0,0];colorStyle(:,:,8)=[0.5,0.5,0];
colorStyle(:,:,9)=[1,0.5,0.5];colorStyle(:,:,10)=[0.5,0,0.5];colorStyle(:,:,11)=[0,0.5,0.5];
colorStyle(:,:,12)=[1,0,0];colorStyle(:,:,13)=[0,0,1];colorStyle(:,:,14)=[0,1,0];colorStyle(:,:,15)=[0,1,1];
colorStyle(:,:,16)=[1,0,1];colorStyle(:,:,17)=[1,1,0];colorStyle(:,:,18)=[0,0,0];colorStyle(:,:,19)=[0.5,0.5,0];
colorStyle(:,:,20)=[1,0.5,0.5];colorStyle(:,:,21)=[0.5,0,0.5];colorStyle(:,:,22)=[0,0.5,0.5];

lineStyle = cell(1,22);
lineStyle(1:11) = {'-','-','-','-','-','-','-','-','-','-','-'};
lineStyle(12:22) = {'--','--','--','--','--','--','--','--','--','--','--'};

basePath='D:/GTOT/GTOT/';           %数据集路径
sequences=dir(basePath);
sequences={sequences.name};
sequences=sequences(3:end);
precisionX=[0:0.5:25];
successX=[0:0.02:1];
% precisionY=zeros(size(precisionX));
precisionY=zeros([size(precisionX,2) size(algs,2)]);
% successY=zeros(size(successX));
successY=zeros([size(successX,2) size(algs,2)]);
allFramesNum=0;

for algIndex=1:size(algs,2),
for seqIndex=1:size(sequences,2),
%     ['results/' algs{1} '/' algs{1} '_' sequences{i} '.mat']
    if (strcmp('MCNet',algs{algIndex})),
        results(seqIndex)=load(['ERRresults/ours' '/' 'ours' '_' sequences{seqIndex} '.mat']);
    else
        results(seqIndex)=load(['ERRresults/' algs{algIndex} '/' algs{algIndex} '_' sequences{seqIndex} '.mat']);
    end
    allFramesNum=allFramesNum+size(results(seqIndex).err,1);
    for j=1:size(successX,2),
    precisionY(j,algIndex)=precisionY(j,algIndex)+sum(results(seqIndex).errCenter<precisionX(j));
    successY(j,algIndex)=successY(j,algIndex)+sum(results(seqIndex).err>successX(j));
    end


end
end

allFramesNum=allFramesNum/size(algs,2);
%sort
 precisionthr(1:size(algs,2))=precisionY(2*pixelThreshold+1,1:size(algs,2))/allFramesNum;

    [~,precisionIndex]=sort(precisionthr,'descend');

h1=figure(1)
for trackerIndex=1:size(algs,2),
 if strcmp(algs{precisionIndex(trackerIndex)},'WJSR')
     algs{precisionIndex(trackerIndex)}='CSR';
 end
 %plot(precisionX,precisionY(:,precisionIndex(trackerIndex))'/allFramesNum,'color',colorStyle(:,:,precisionIndex(trackerIndex)),'LineWidth',3,'LineStyle',lineStyle(:,:,precisionIndex(trackerIndex)));
 plot(precisionX,precisionY(:,precisionIndex(trackerIndex))'/allFramesNum,'color',colorStyle(:,:,precisionIndex(trackerIndex)),'LineWidth',3,'LineStyle',lineStyle{precisionIndex(trackerIndex)});

 hold on
 precision=num2str(precisionY(2*pixelThreshold+1,precisionIndex(trackerIndex))/allFramesNum,3);
 legendLabel{trackerIndex}=[algs{precisionIndex(trackerIndex)} '[' precision ']'];
end


title('Precision Plot');
% xlabel(h1,'string', 'Location error threshold','FontSize',20)
% ylabel(h1,'string','Precision','FontSize',20)
xlabel( 'Location error threshold','FontSize',20)
ylabel( 'Precision','FontSize',20)
legend(legendLabel);
saveas(1,'PR_TPR.fig');
saveas(1,'PR_TPR.jpeg');

% auc(successX,successY(:,1)'/allFramesNum)
% auc(successX,successY(:,2)'/allFramesNum)
%sort
for i=1:size(algs,2),
successthr(i)=auc(successX,successY(:,i)'/allFramesNum);
end

    [~,successIndex]=sort(successthr,'descend');

h2=figure(2)
for trackerIndex=1:size(algs,2),
%plot(successX,successY(:,successIndex(trackerIndex))'/allFramesNum,'color',colorStyle(:,:,successIndex(trackerIndex)),'LineWidth',3,'LineStyle',lineStyle(:,:,successIndex(trackerIndex)));
plot(successX,successY(:,successIndex(trackerIndex))'/allFramesNum,'color',colorStyle(:,:,successIndex(trackerIndex)),'LineWidth',3,'LineStyle',lineStyle{successIndex(trackerIndex)});
hold on
area=num2str(auc(successX,successY(:,successIndex(trackerIndex))'/allFramesNum),3);
legendLabel1{trackerIndex}=[algs{successIndex(trackerIndex)} '[' area ']'];
end
title('Success Plot');
% xlabel(h2,'string', 'overlap threshold','FontSize',20)
% ylabel(h2,'string','Success Rate','FontSize',20)
xlabel( 'overlap threshold','FontSize',20)
ylabel( 'Success Rate','FontSize',20)
legend(legendLabel1);
saveas(2,'SR_TPR.fig');
saveas(2,'SR_TPR.jpeg');
注意所有代码必须在该路径下运行,而且①②准备代码只需要修改一下路径就行了,并不需要运行,也运行不出来:

大家只用修改我%之前的那些路径即可,其他的代码不用修改