【监控指标】监控系统-prometheus、grafana。容器化部署。go语言 gin框架、gRPC框架的集成
文章目录
- 一、监控有哪些指标
- 二、prometheus、grafana架构
- Prometheus 组件
- Grafana 组件
- 架构优点
- 三、安装prometheus和node-exporter
- 1. docker pull镜像
- 2. 启动node-exporter
- 3. 启动prometheus
- 四、promql基本语法
- 五、grafana的安装和使用
- 1. 新建空文件夹grafana-storage,用来存储数据
- 2. 启动grafana(如果和已有的端口冲突改一下端口)
- 3. 配置prometheus并使用
- 六、导入Grafana模板
- 七、guages、counter、histograms指标
- guages
- Counter
- Histograms
- 八、go语言集成prometheus
- 九、grpc框架集成prometheus
- 十、gin框架集成prometheus
一、监控有哪些指标
监控1. 业务监控(上层概念 - 领导层):需求方:老板、运营开发方: 大数据库 ,都会访问业务库,大数据库会从同步库, 宽表QPS、DAU日活、访问状态(http code)、业务接口(登录、注册、聊天、上传、留言、搜索、投诉)、 产品转换率、充值额度2. 系统监控需求方: 运维开发方: 运维操作系统相关: cpu使用率、内存使用、磁盘使用率、磁盘空间(非常常见)、TCP(上W的链接),流量组件: mysql、redis、kafka3. 日志监控需求方:运维、开发开发方:开发两种日志:业务日志(大数据, 普通日志)、 系统日志(操作系统日志、mysql组件日志、kakfa的日志)监控中的重头戏,一般我们都会对单独针对日志设计日志管理系统, ELK日志系统, loki4. 网络监控:需求方:机房管理开放方:服务器管理IDC 交换机、路由器、防火墙、负载均衡、服务器、机柜、电源、UPS、空调、网络设备、机房环境监控,网络:内部网络(物理内网,虚拟内网(VPN))监控5. 程序监控:需求方:开发开发方:开发比如产生了 500 ErrUserNotFound一般要运维和开发人员配合,开发人员在程序中提供监控接口,运维人员通过接口获取监控数据prometheus的数据格式: metricsmetrics是一种对采样数据的总称二、prometheus、grafana架构
官网:https://prometheus.fuckcloudnative.io/di-yi-zhang-jie-shao/overview
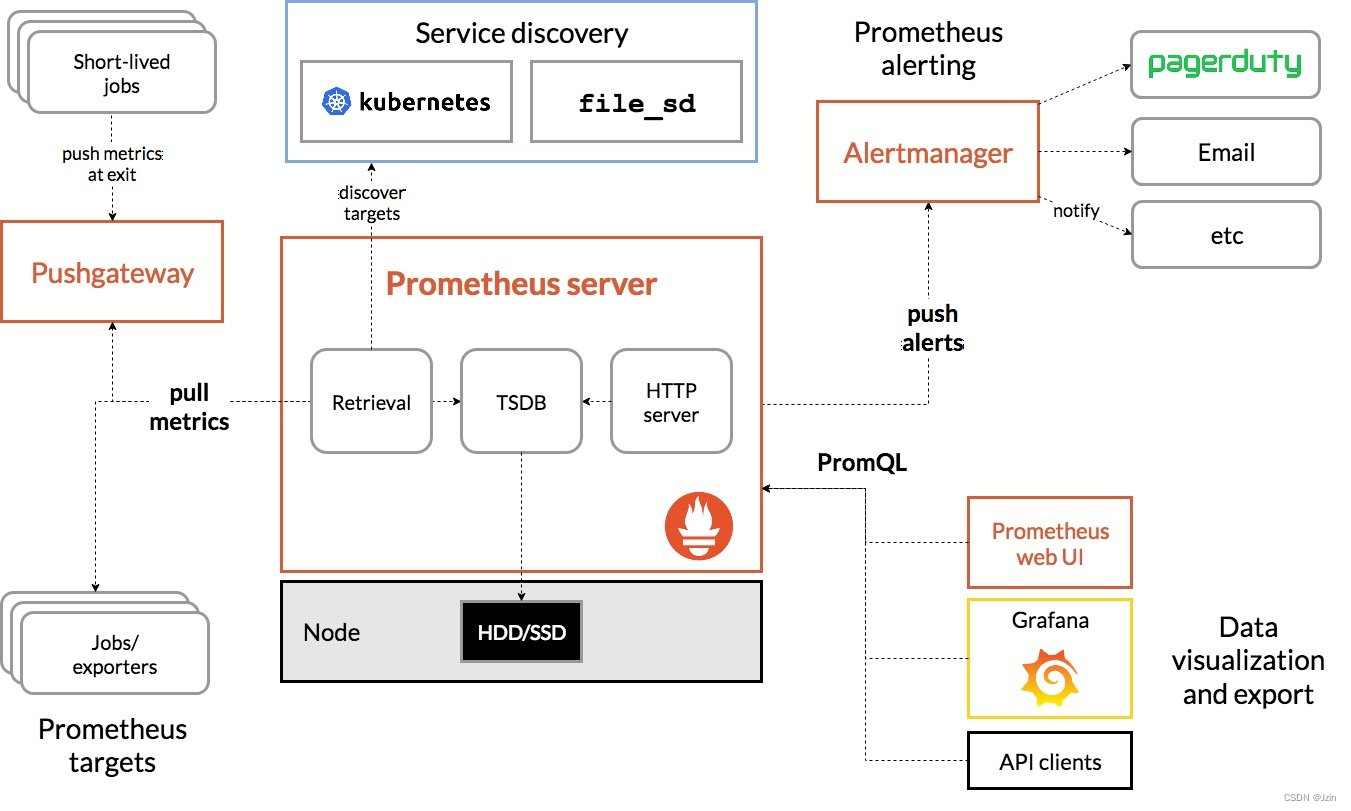
Prometheus 组件
- Prometheus server:Prometheus 的核心组件,负责收集、存储和查询时间序列数据。
- Exporters:Exporters 是 Prometheus 用来从目标系统收集数据的插件。Exporters 可以是主动拉取数据的,也可以是被动推送数据的。
- Pushgateway:Pushgateway 是一个被动推送数据的 Exporter,用于收集短暂运行的任务或服务的数据。
- Alertmanager:Alertmanager 负责处理 Prometheus 发出的告警,并将告警发送到指定的通知系统。
- Prometheus web UI:Prometheus 自带的 Web 界面,用于查看 Prometheus 收集的数据。
Grafana 组件
- Grafana:一个开源的图形化数据可视化工具,用于将 Prometheus 的数据进行可视化展示。
架构说明
Prometheus通过 Exporters 从目标系统收集数据,并将数据存储到 Prometheus server。Prometheus server 还可以通过 Pushgateway 收集短暂运行的任务或服务的数据。Alertmanager 负责处理 Prometheus 发出的告警,并将告警发送到指定的通知系统。Prometheus web UI 用于查看 Prometheus 收集的数据。
Grafana 与 Prometheus 的结合
Grafana 可以与 Prometheus 结合使用,将 Prometheus 的数据进行可视化展示。Grafana 可以创建各种类型的图表,用于展示 Prometheus 的数据,例如曲线图、柱状图、饼图等。
架构优点
Prometheus 和 Grafana 的结合具有以下优点:
- 可扩展性:Prometheus 和 Grafana 都是可扩展的系统,可以满足不同规模的监控需求。
- 灵活性:Prometheus 和 Grafana 提供了丰富的功能,可以满足不同的监控需求。
- 开源:Prometheus 和 Grafana 都是开源软件,可以免费使用。
三、安装prometheus和node-exporter
1. docker pull镜像
docker pull prom/node-exporter
docker pull prom/prometheus
docker pull grafana/grafana
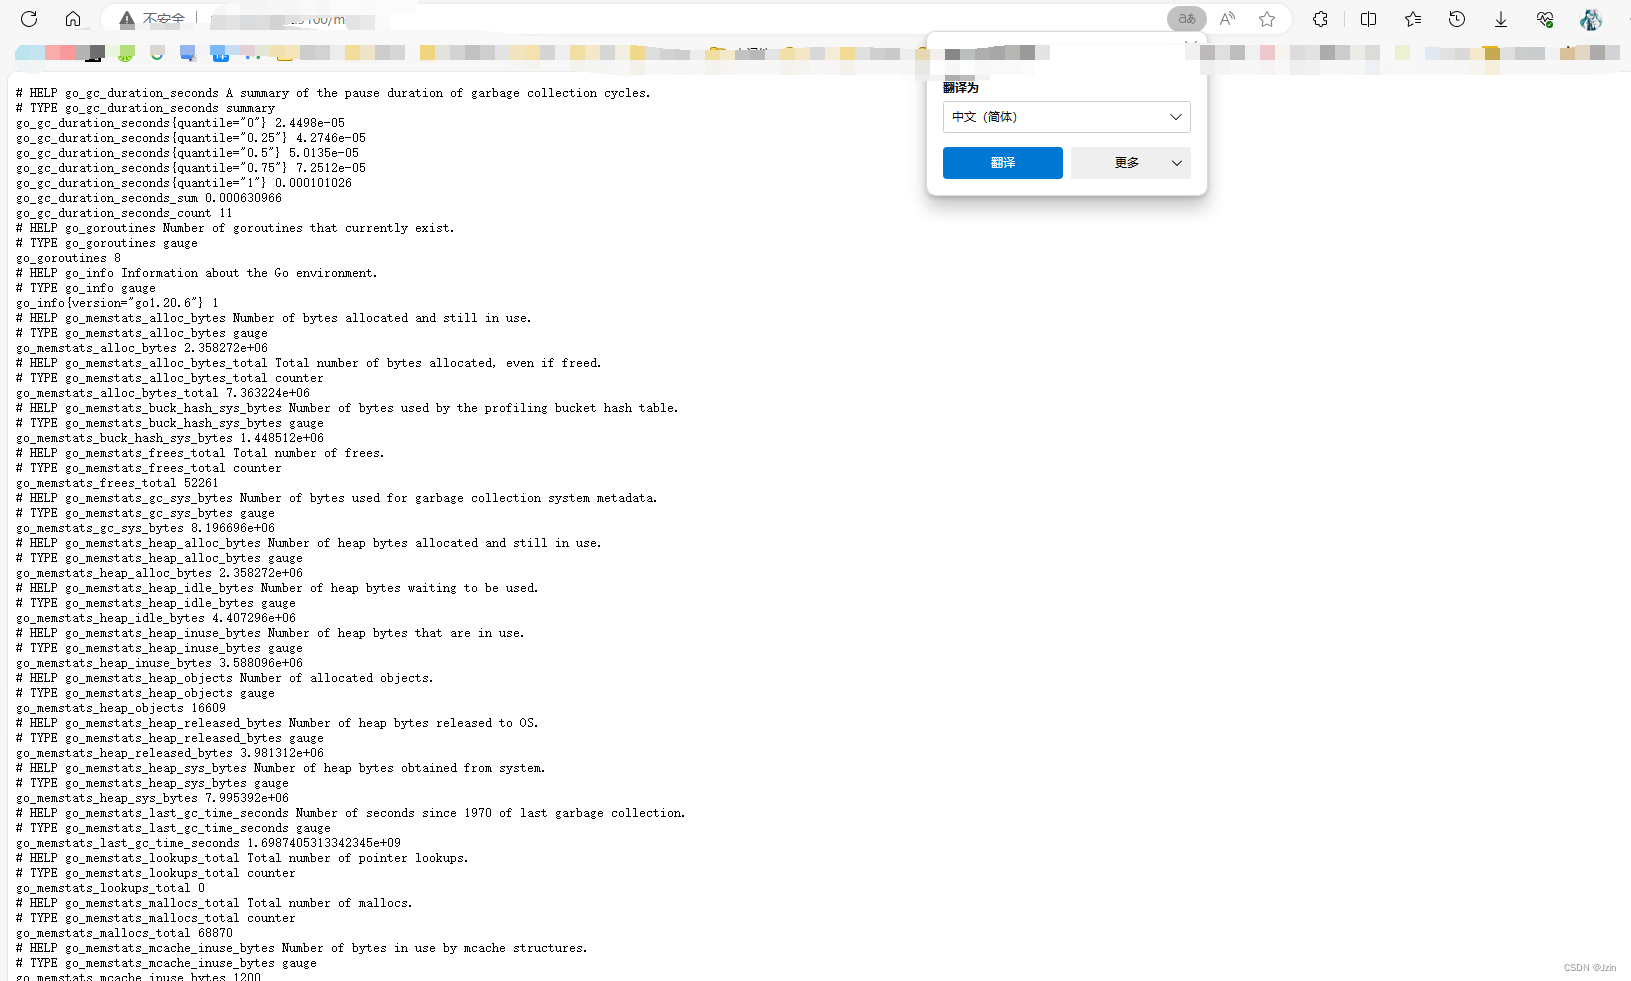
2. 启动node-exporter
docker run -d -p 9100:9100 -v "/proc:/host/proc:ro" -v "/sys:/host/sys:ro" -v "/:/rootfs:ro" prom/node-exporter
访问url:
http://127.0.0.1:9100/metrics
3. 启动prometheus
建立 /opt/prometheus/prometheus.yml
内容如下:
global:scrape_interval: 60sevaluation_interval: 60sscrape_configs:- job_name: prometheusstatic_configs:- targets: ['localhost:9090']labels:instance: prometheus- job_name: linuxstatic_configs:- targets: ['自己的ip:9100']labels:instance: localhost
启动:
docker run -d \
-p 9090:9090 \
-v /opt/prometheus/prometheus.yml:/etc/prometheus/prometheus.yml \
prom/prometheus
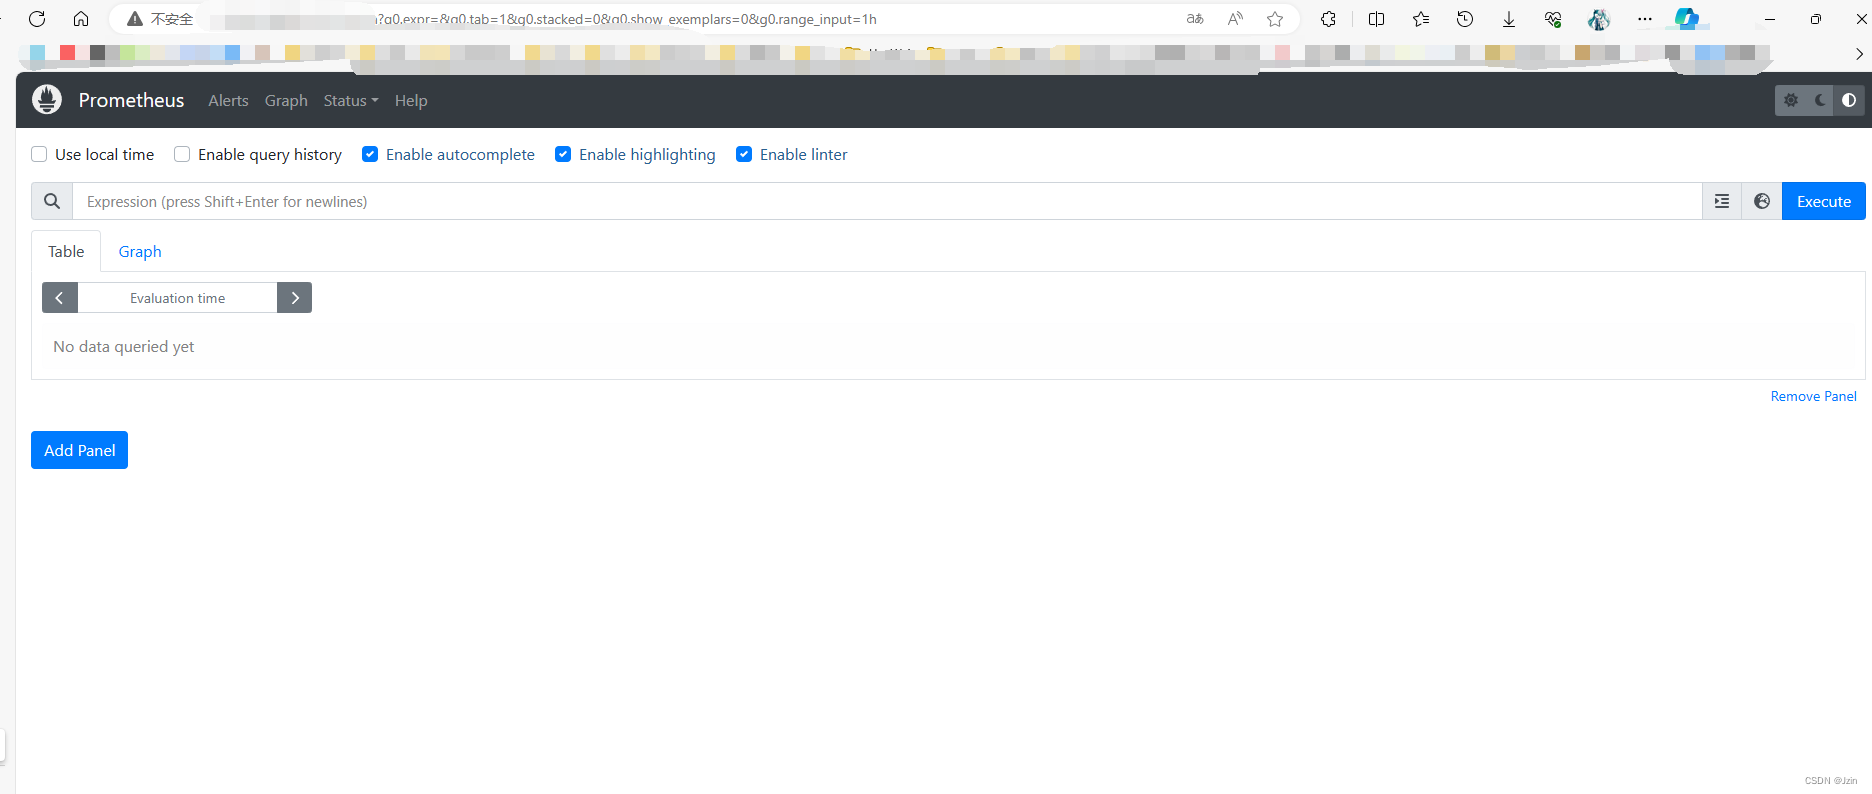
访问url:
127.0.0.1:9090/graph
四、promql基本语法
不需要花过多的精力学习它 用到的时候使用即可
Prometheus Query Language(PromQL)是用于查询和分析从 Prometheus 中收集的监控指标数据的查询语言。以下是 PromQL 的基本语法和一些常见的查询操作符:
-
选择时间范围:
time(): 获取当前时间戳。timestamp(): 将时间戳转换为日期和时间。offset <duration>: 偏移查询的时间范围。
-
选择指标数据:
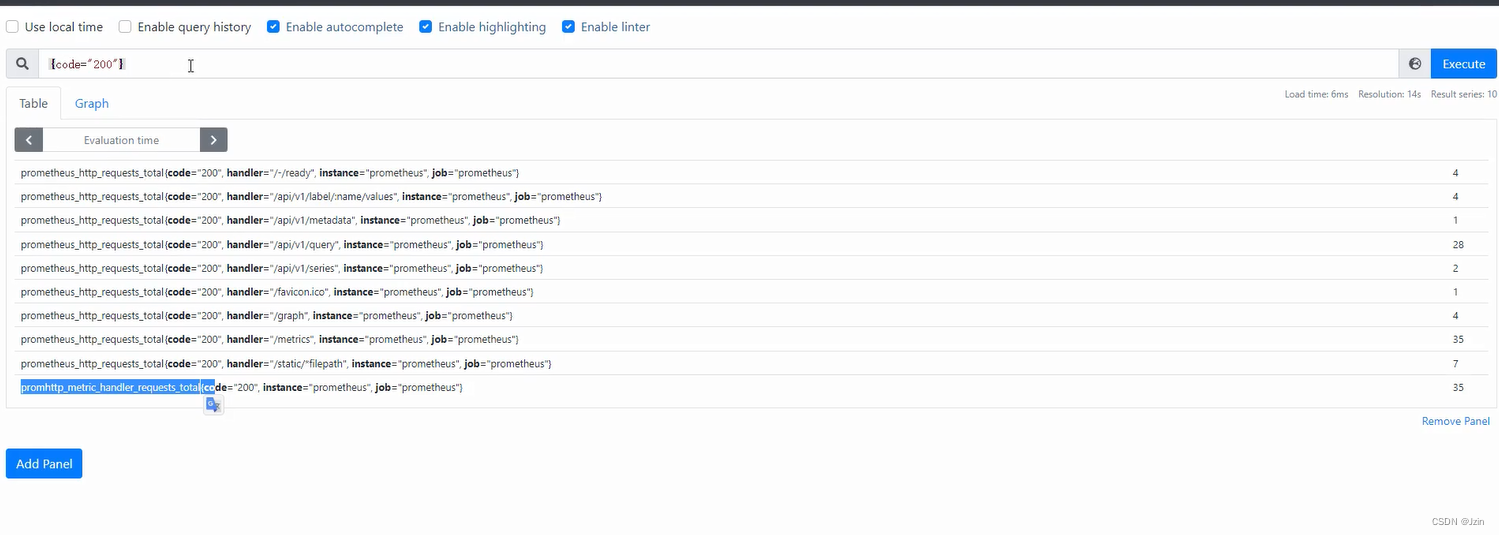
<metric_name>: 选择具体的指标名称。{<label_name>=<label_value>}: 使用标签选择指标实例。up{job="api"}: 选择标签job等于api的指标数据。
-
基本查询操作符:
=: 等于。!=: 不等于。=~: 正则表达式匹配。!~: 不匹配正则表达式。
-
聚合操作:
sum(<vector>): 对指标数据进行求和。avg(<vector>): 对指标数据取平均值。min(<vector>): 获取指标数据的最小值。max(<vector>): 获取指标数据的最大值。count(<vector>): 计算指标数据的数量。rate(<vector>[<duration>]): 计算速率,通常用于计算速率指标,例如请求速率。increase(<vector>[<duration>]): 计算增长量,通常用于计算计数器类型的指标。
-
时间窗口:
[<duration>]: 指定查询的时间范围。offset <duration>: 设置查询时间范围的偏移量。
-
聚合函数:
by(<label>): 按标签对结果进行分组。topk(<k>, <vector>): 获取前 k 个结果。quantile(<q>, <vector>): 计算分位数。
-
布尔操作:
and: 逻辑与。or: 逻辑或。unless: 逻辑非。
-
函数:PromQL 支持多种函数,用于对指标数据进行操作和处理,如
abs(),floor(),ceil(),round()等。 -
括号:可以使用括号来控制操作符的优先级。
以下是一些示例 PromQL 查询:
up{job="api"}: 选择标签job等于api的up指标数据。sum(rate(http_requests_total{job="web"}[5m])): 计算过去 5 分钟内job为web的http_requests_total指标的速率总和。node_cpu{mode="idle"} / ignoring(cpu) group_left sum(node_cpu):计算node_cpu中mode为 “idle” 的 CPU 使用率与所有 CPU 使用率的比例,同时按node_cpu的标签进行分组。
PromQL 具有丰富的功能和语法,允许您执行各种复杂的查询和分析操作,以满足您的监控需求。要深入了解 PromQL,请参考 Prometheus 官方文档或相关教程。
五、grafana的安装和使用
1. 新建空文件夹grafana-storage,用来存储数据
mkdir /opt/grafana-storage
chmod 777 -R /opt/grafana-storage
2. 启动grafana(如果和已有的端口冲突改一下端口)
docker run -d -p 3000:3000 --name=grafana -v /opt/grafana-storage/:/var/lib/grafana grafana/grafana
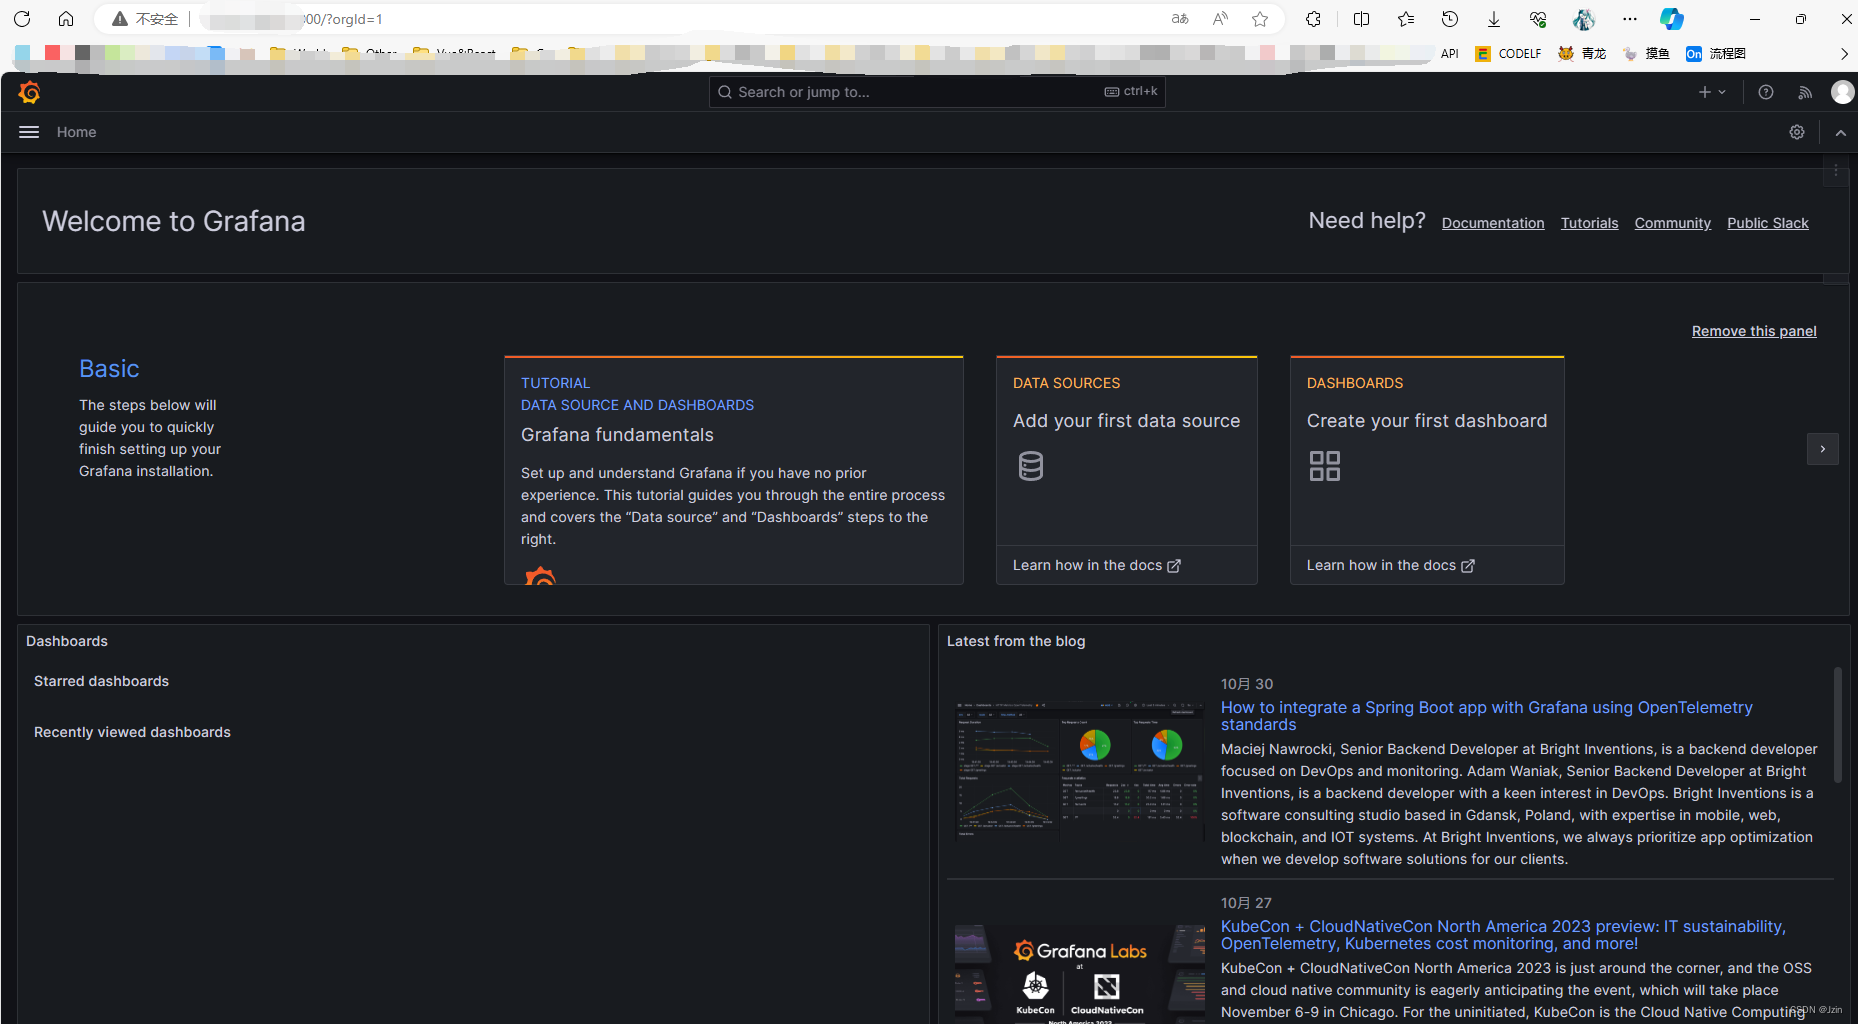
访问:
127.0.0.1:3000
默认用户名密码:admin/admin
3. 配置prometheus并使用
点进Data sources
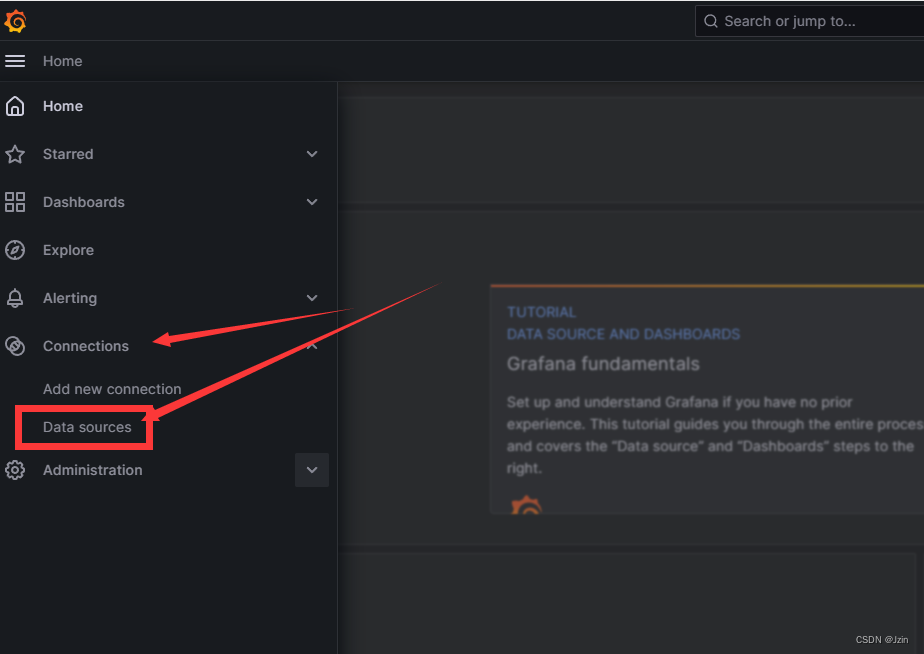
然后add一个
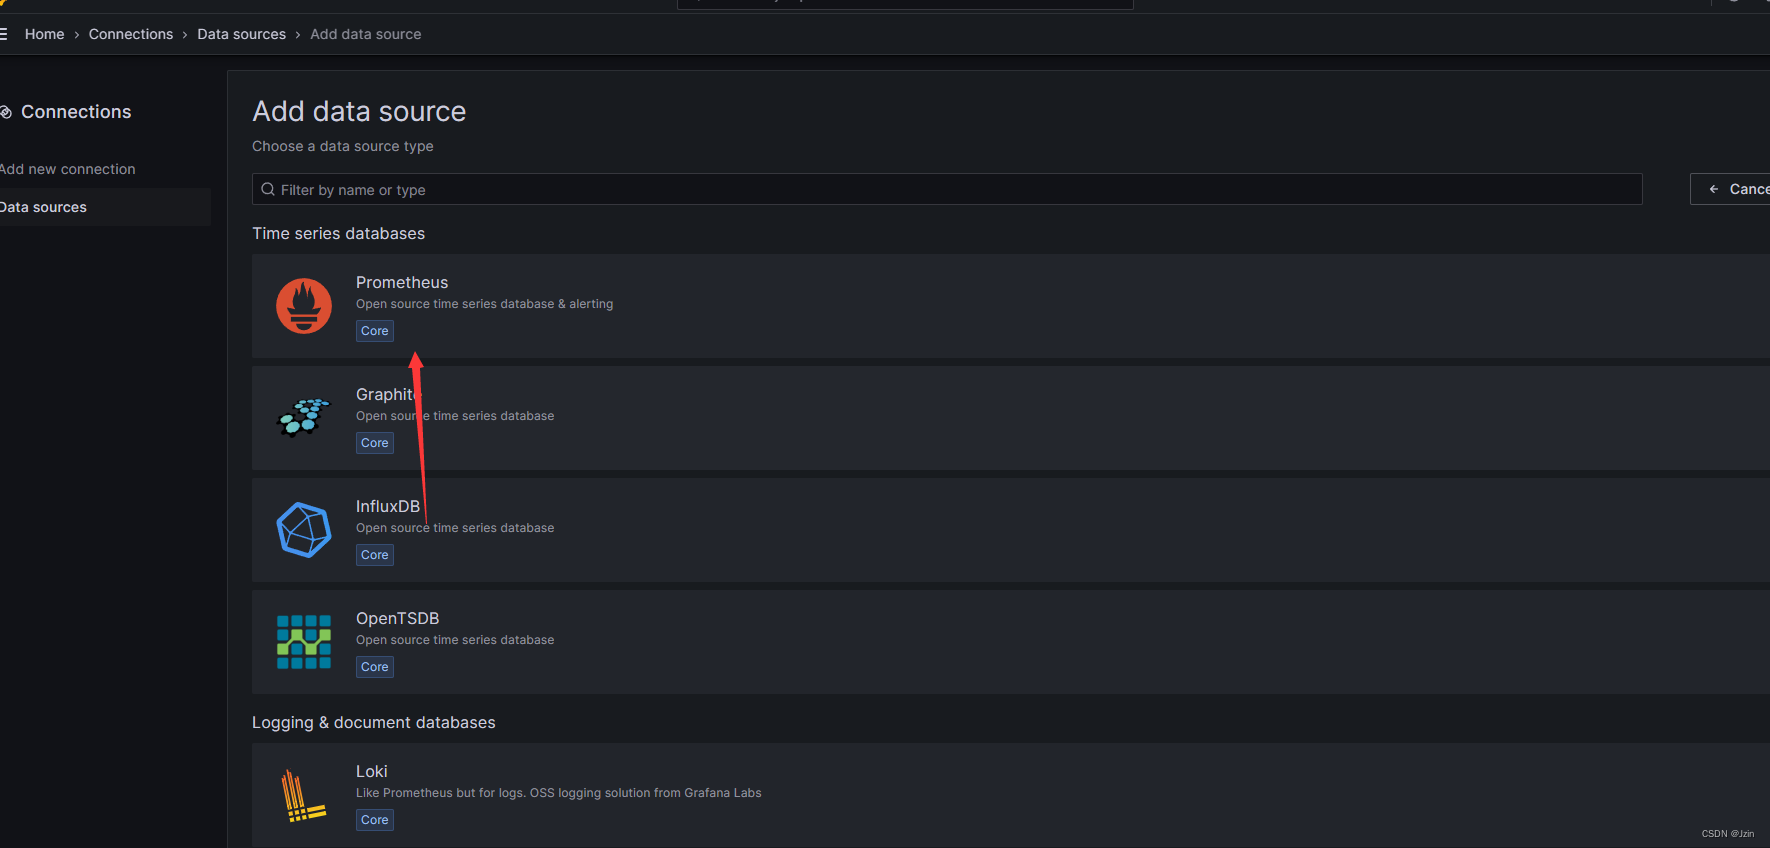
输入自己的ip直接完成:
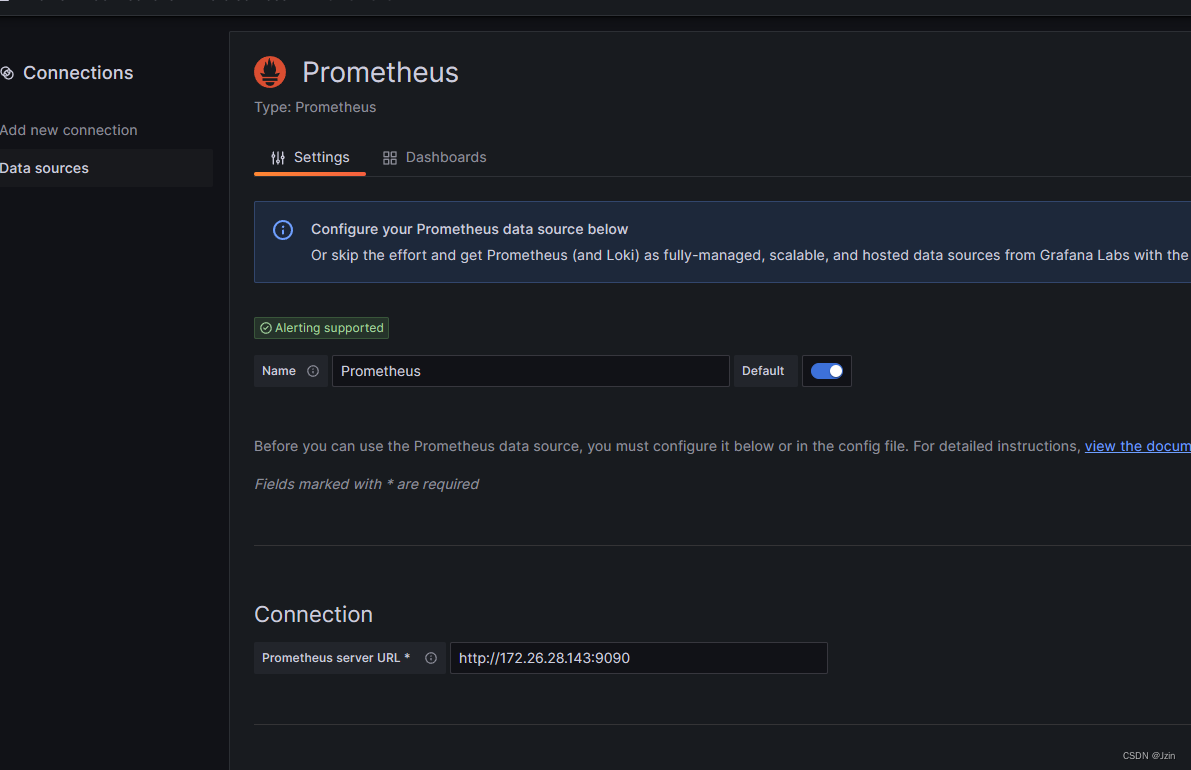
这时候没有展示 展示什么需要自己配置
重点了解一下panel或row就可以了
panel是仪表盘
row是很多panel
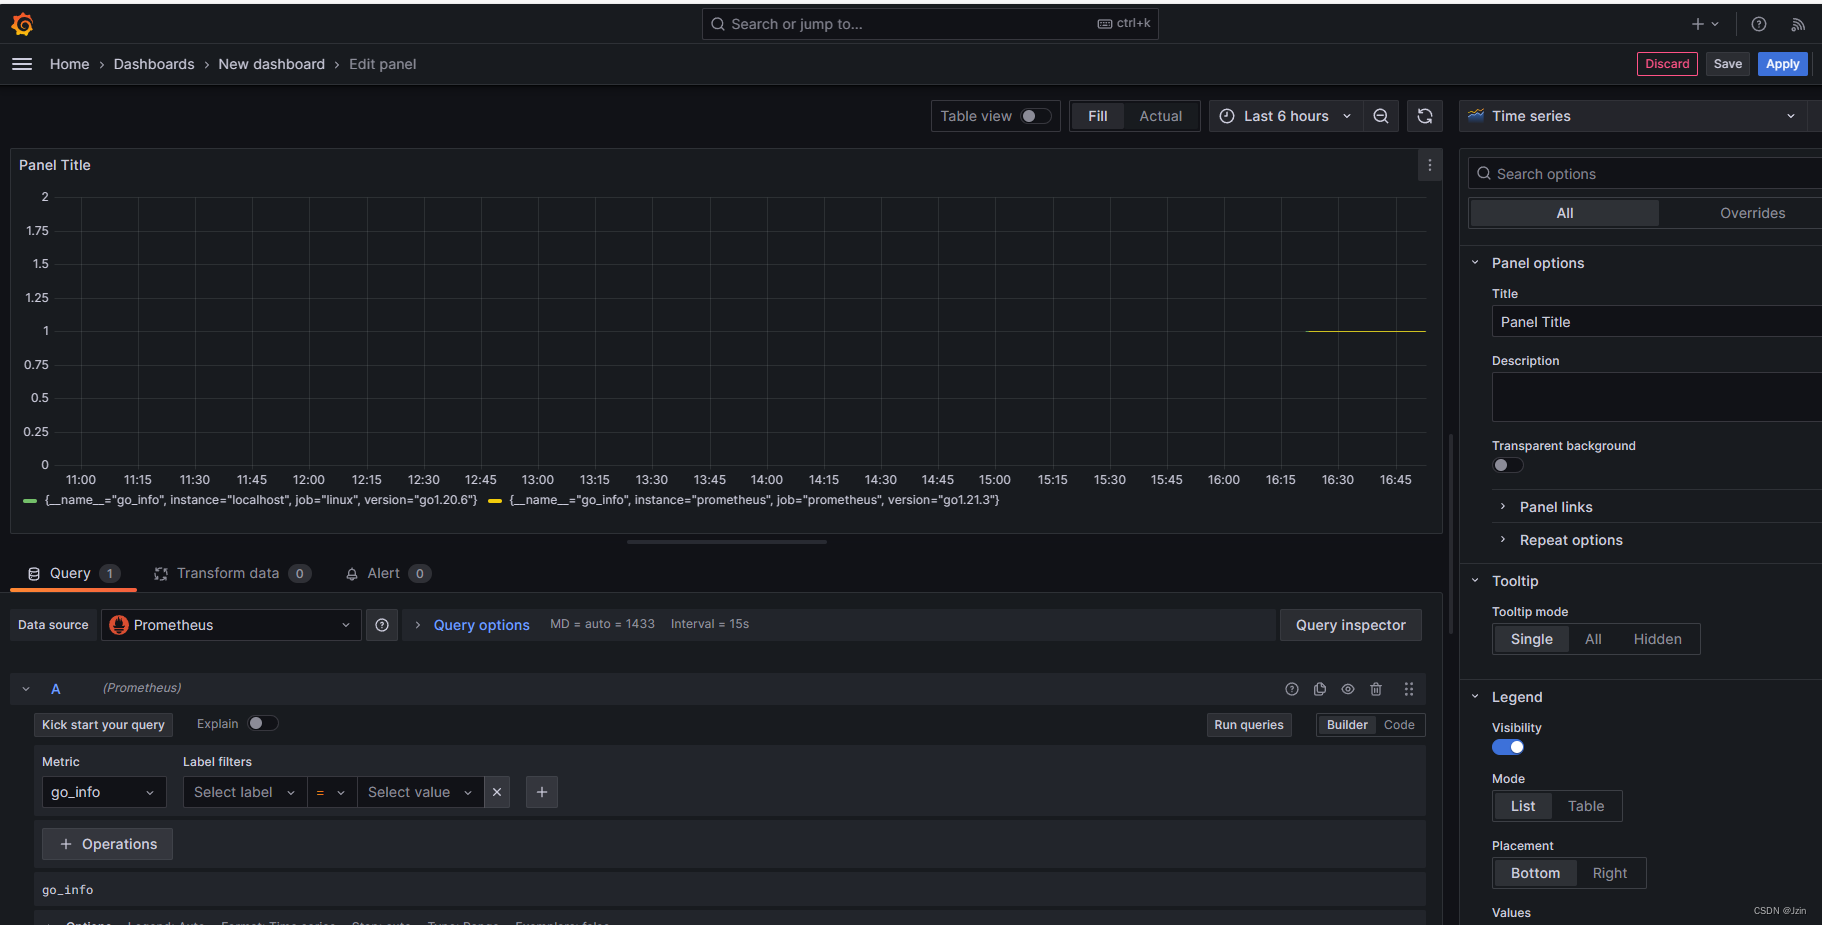
这里直接点蓝按钮了
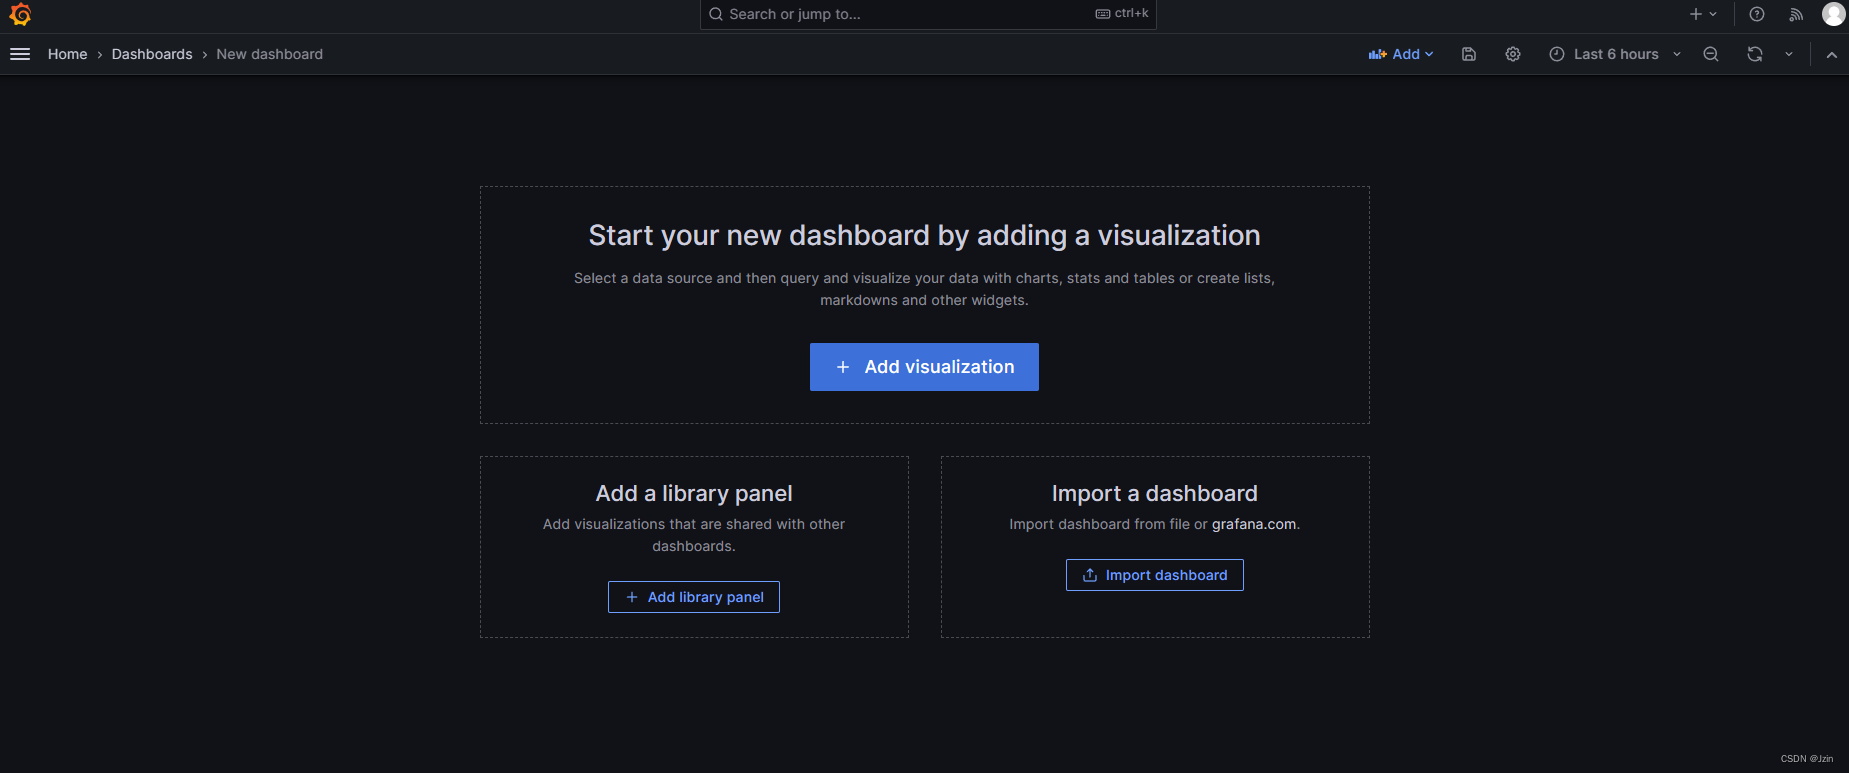
然后进行查询就可以看到数据了
这里apply以后可以save保存
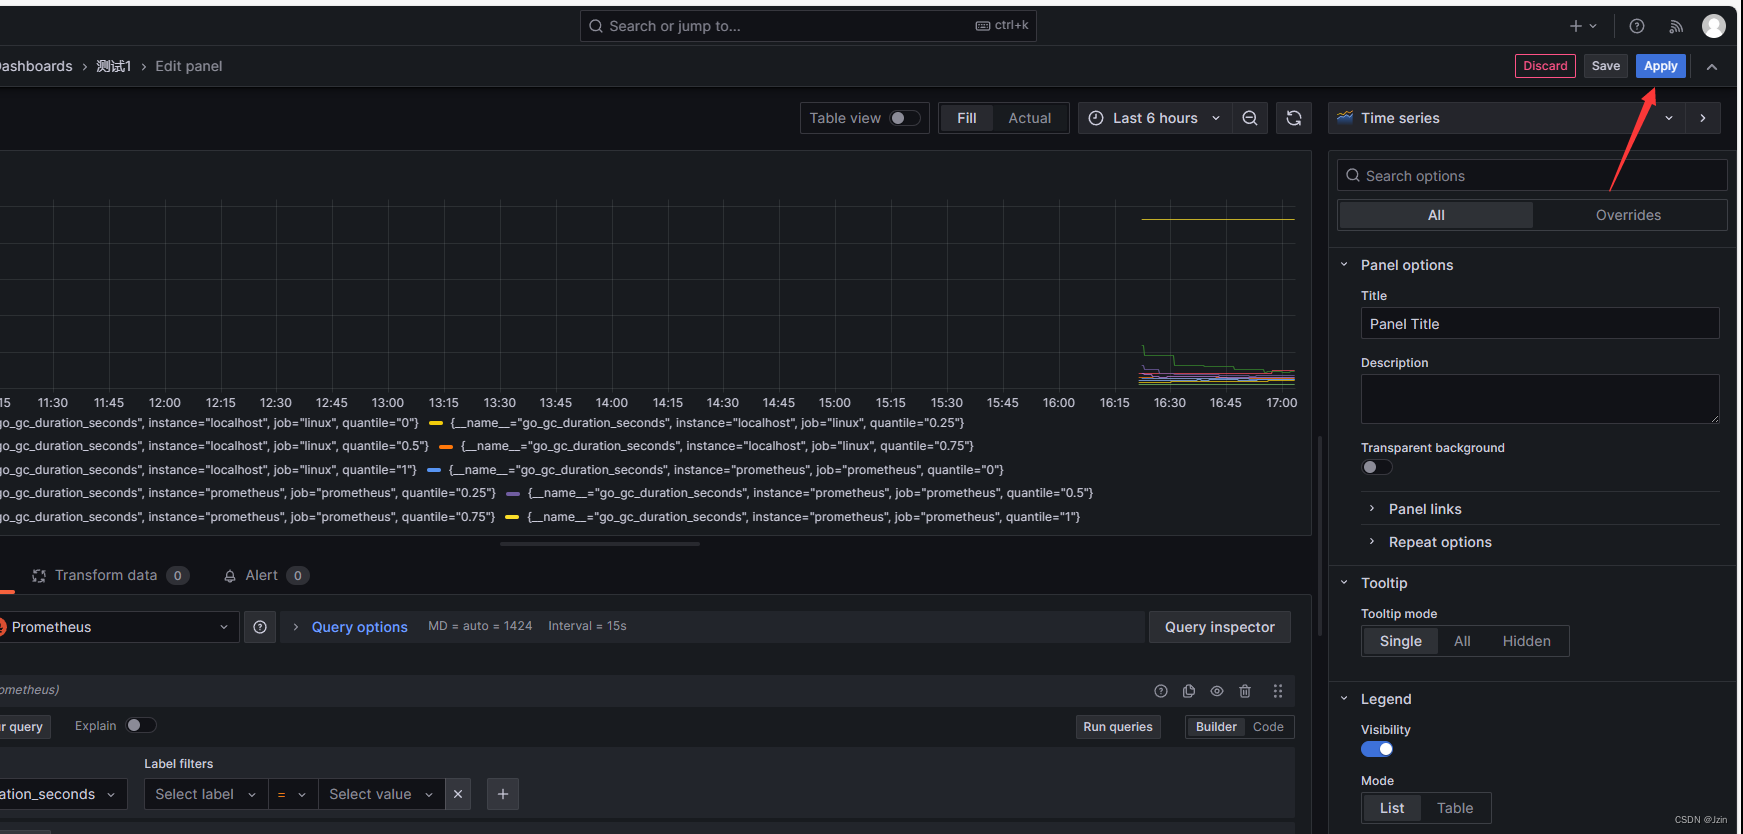
保存完以后可以直接进来看你创建的指标 也就是一个row
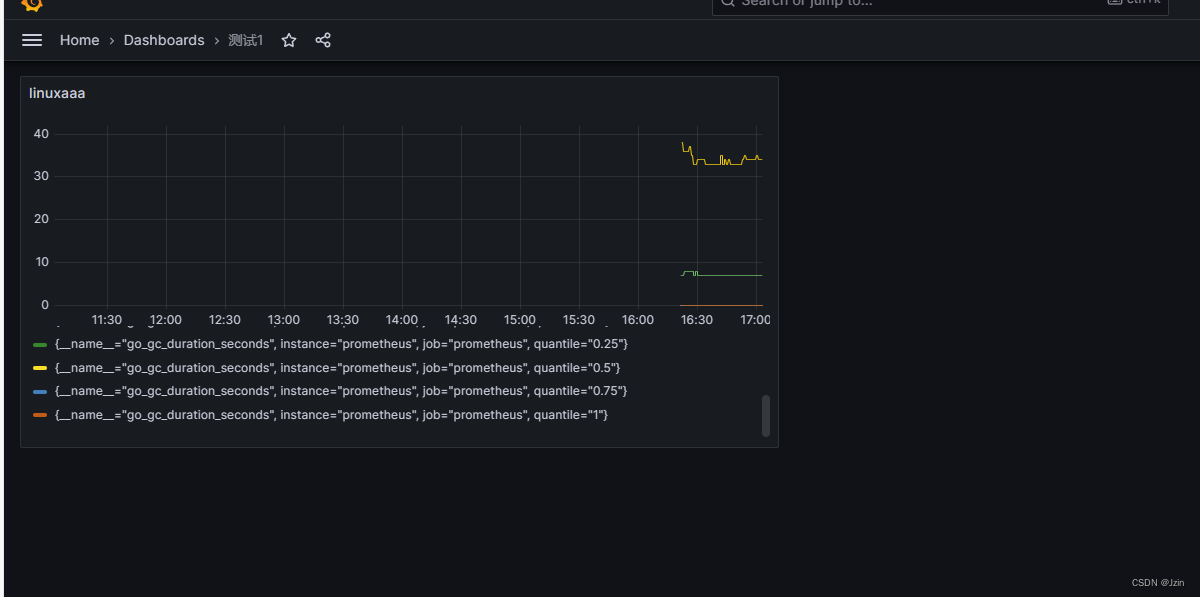
六、导入Grafana模板
官方模板:grafana.com/grafana/dashboards/?search=kafka
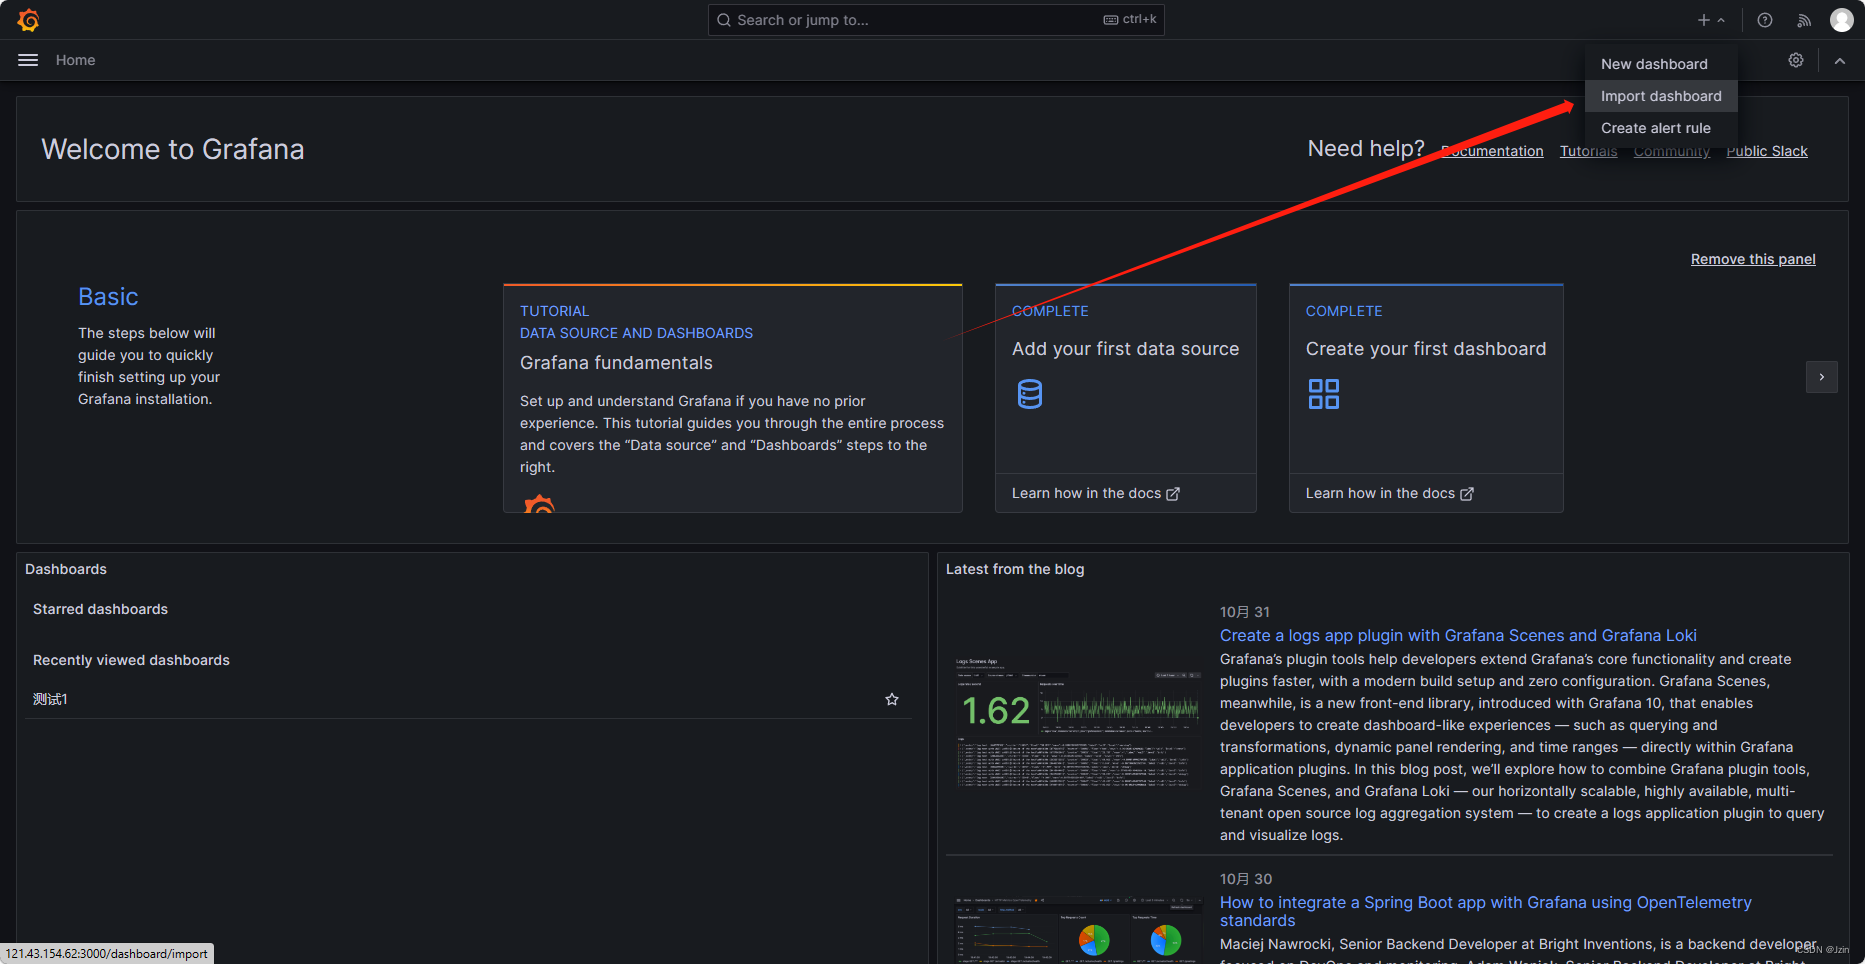
比如找一个redis的模板下载:
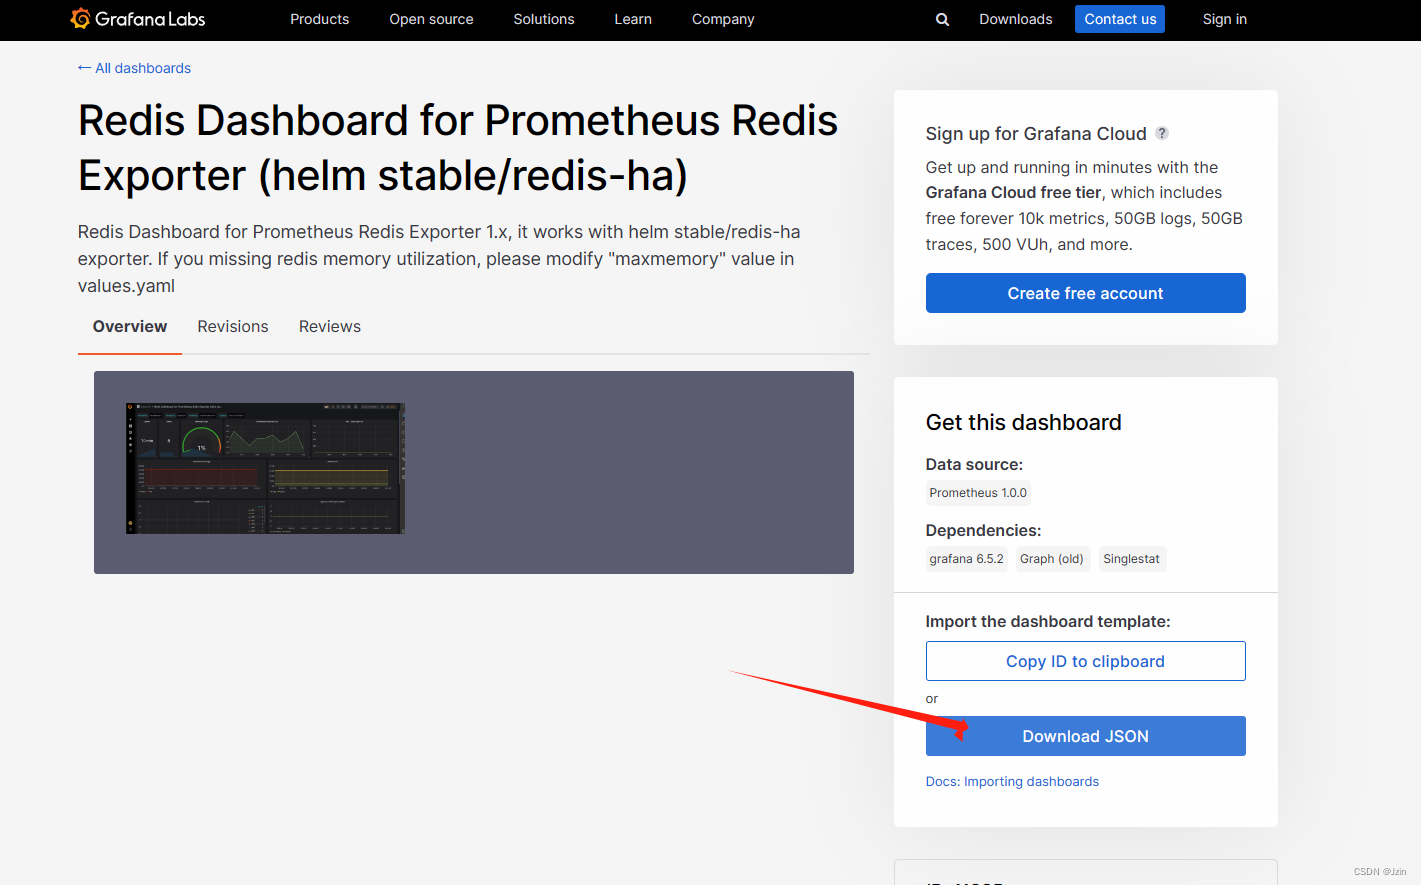
下载完json之后导入到grafana:
可以找其他的模板导入 比如jaeger redis等等
七、guages、counter、histograms指标
guages
最简单的度量指标,只是一个简单的返回值,或者叫瞬时状态,我们想要知道一个队列中的个数
比如:当前的内存使用率、当前的CPU使用率、当前的磁盘使用率、当前的磁盘空间、当前的TCP连接数、当前的流量、当前的QPS、当前的DAU、当前的访问状态、当前的业务接口、当前的产品转换率、当前的充值额度、当前的业务日志、当前的系统日志、当前的网络设备、当前的服务器、当前的机柜、当前的电源、当前的UPS、当前的空调、当前的网络设备、当前的机房环境监控、当前的程序监控
随着时间的推移, 这个值是不断变化的, 这个值有可能增加,有可能减少
Counter
是计数器, 这个值是从0开始累积,在理想状态下,这个值不可能减少
在理想状态下:如果我的服务器重启,同时这个数是放在内存中的
guages和counter是最主要的类型 70%
Histograms
http_res_time 表示http请求的响应时间
nginx
如果我要统计一天的所有访问的平均耗时
如果我们统计下来平均耗时是50ms 但是, 现在中午有一段时间系统卡住了, 1W个请求 平均耗时是在5s,
但是由于我们每天的访问量很大, 1000W访问量,这个5s耗时的请求就被平均掉了
越早发现越好, 有可能是程序的bug,也有可能是系统的bug
50ms以内有多少请求, 50-200ms有多少请求 200ms-500ms有多少请求 500ms-1s有多少请求 1s-5s有多少请求 5s以上有多少请求
分布式图
八、go语言集成prometheus
直接上代码:
package mainimport ("github.com/gin-gonic/gin""github.com/prometheus/client_golang/prometheus""github.com/prometheus/client_golang/prometheus/promauto""github.com/prometheus/client_golang/prometheus/promhttp""time"
)// 声明一个counter
var (opt = promauto.NewCounter(prometheus.CounterOpts{Name: "jzin_test",Help: "just for test",})
)// 每秒自增
func recordMetrics() {for {opt.Inc()time.Sleep(2 * time.Second)}
}// 启动一个http服务,暴露metrics 让prometheus拉取
func main() {go recordMetrics()r := gin.Default()//promauto.NewCounter会把counter注册到defaultRegisterer中 gin.WrapH(promhttp.Handler())会把defaultRegisterer中的metrics暴露出来r.GET("/metrics", gin.WrapH(promhttp.Handler()))_ = r.Run(":8050")
}
启动后集成到/opt/prometheus里 添加你自己的ip:端口
比如:
global:scrape_interval: 60sevaluation_interval: 60sscrape_configs:- job_name: prometheusstatic_configs:- targets: ['localhost:9090']labels:instance: prometheus- job_name: linuxstatic_configs:- targets: ['172.26.28.143:9100', '你自己的ip:端口']labels:instance: localhost然后重新运行prometheus
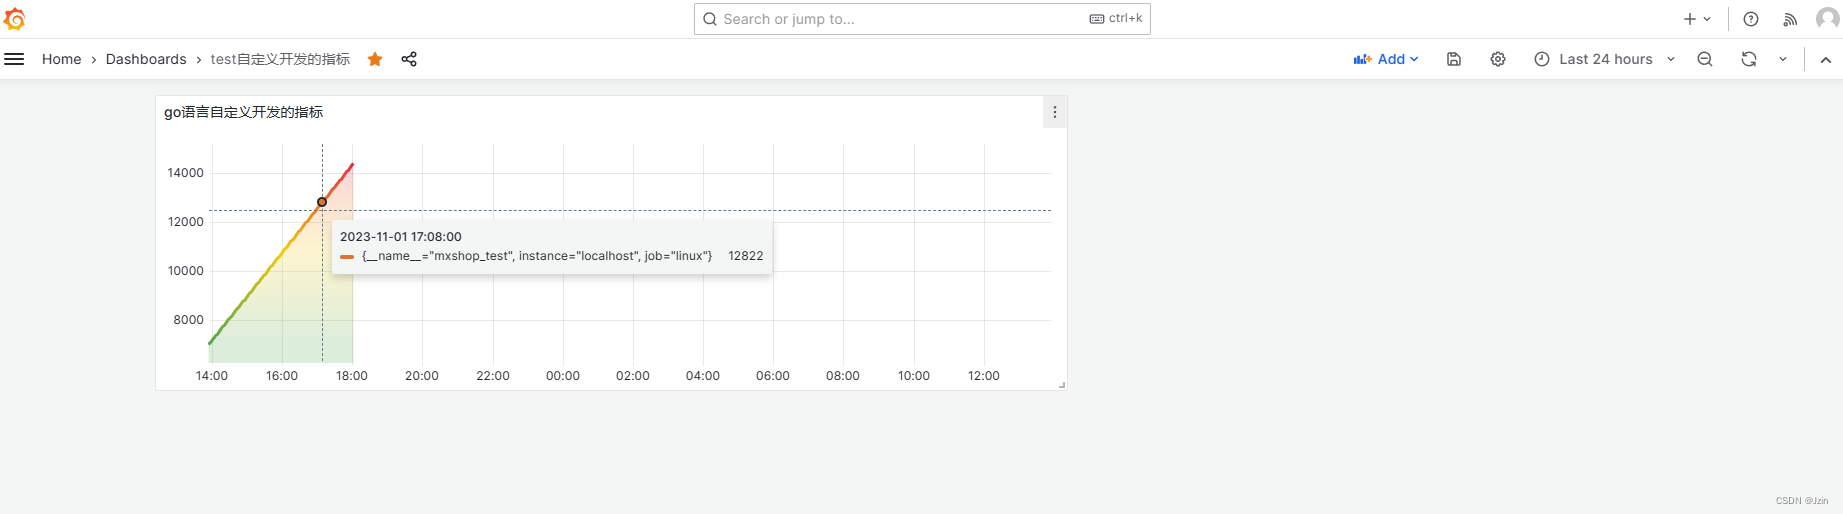
测试:
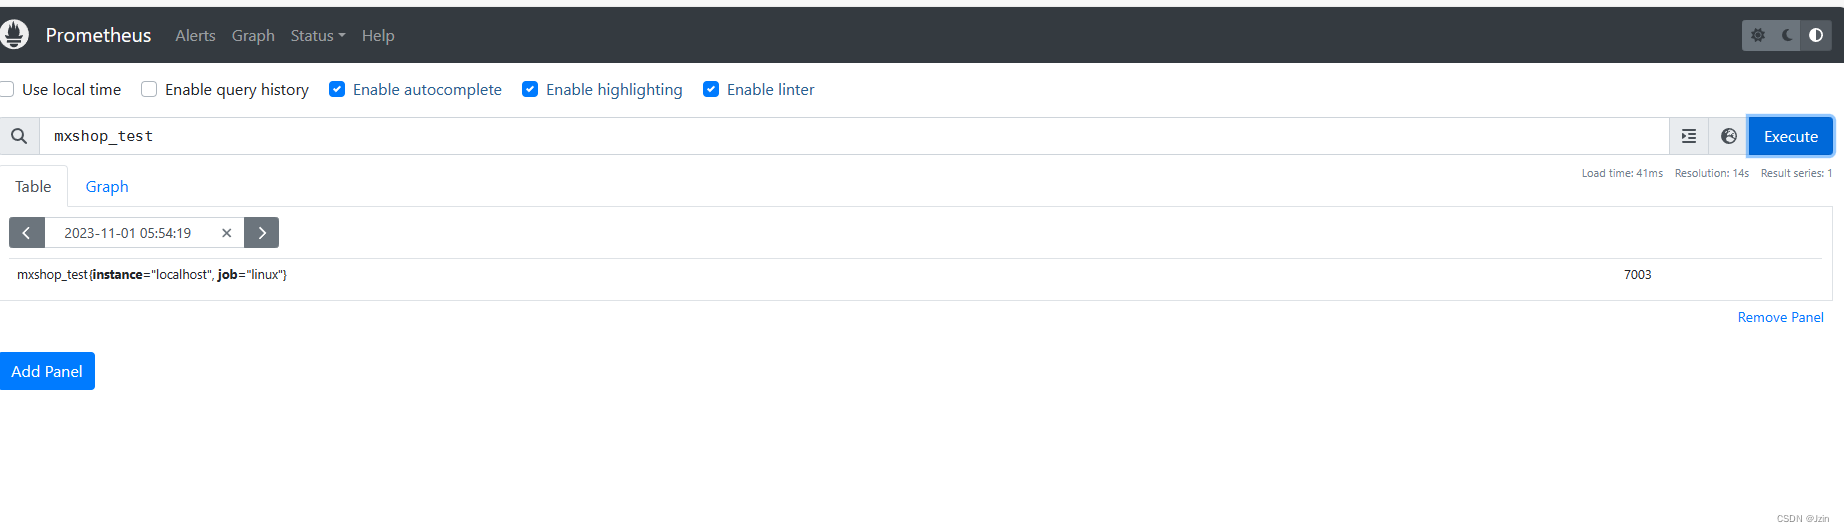
也可以集成到Garfana中
九、grpc框架集成prometheus
代码有点多 有点复杂 想要的私信吧
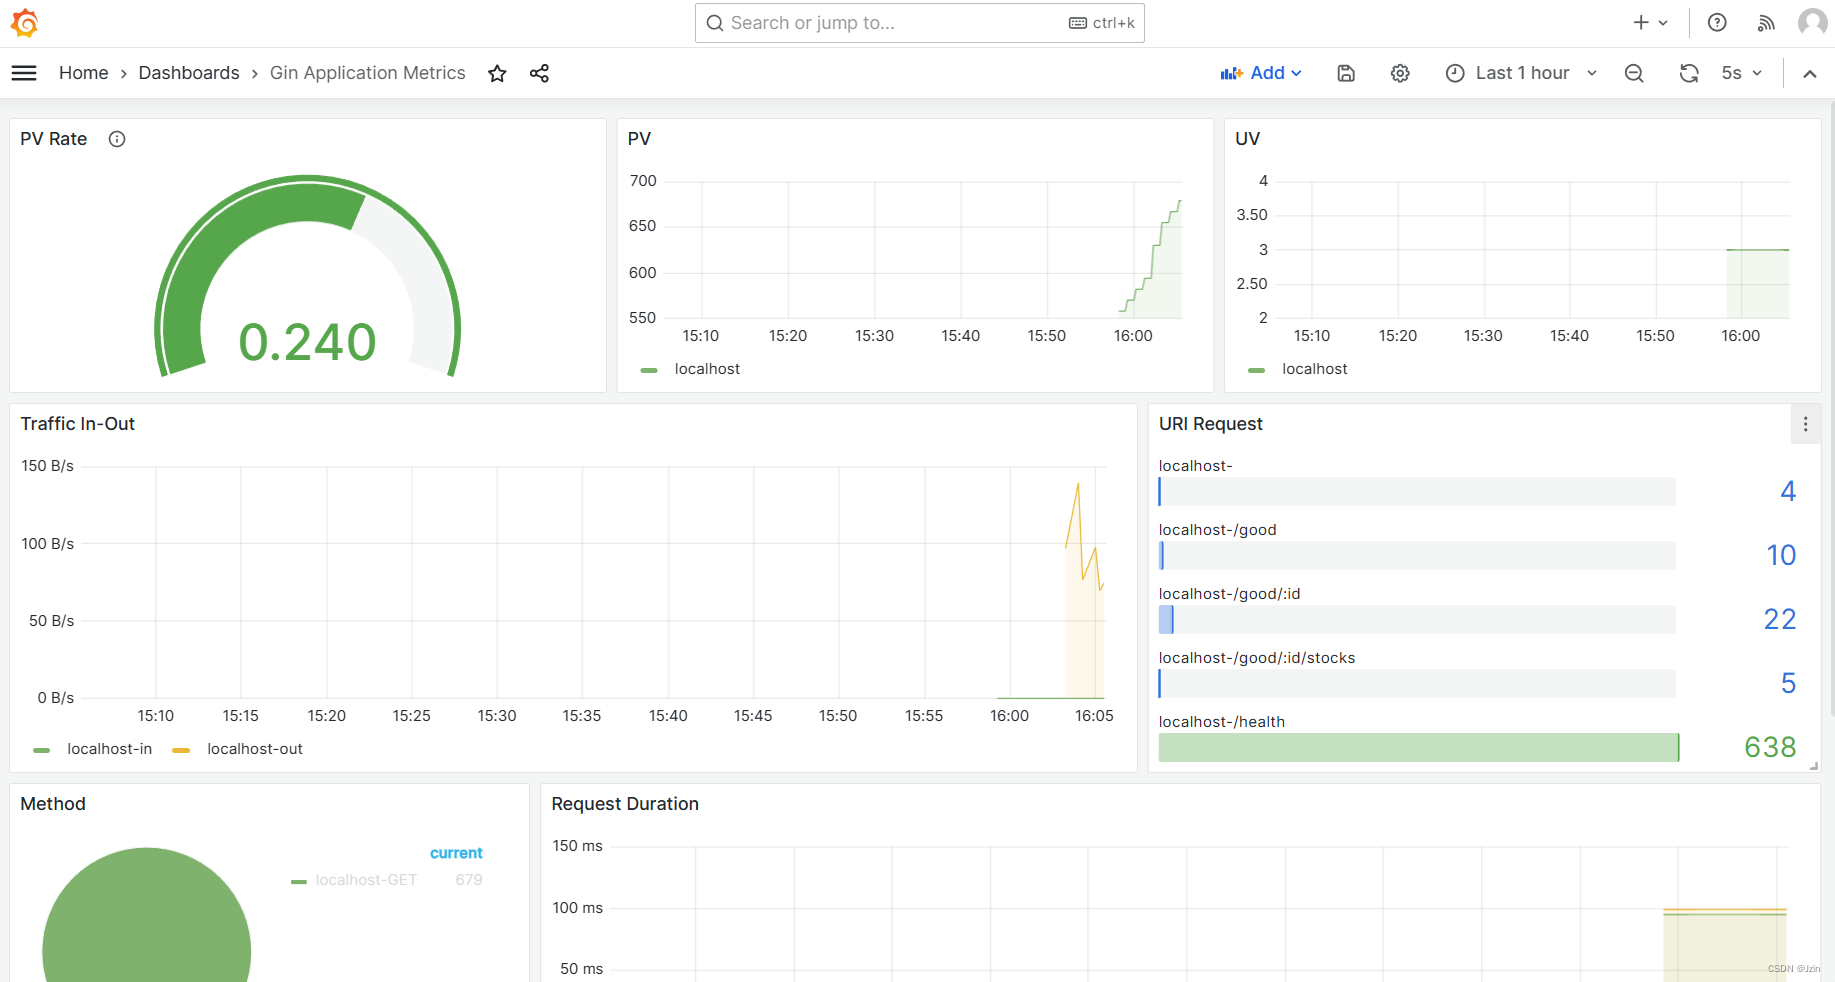
十、gin框架集成prometheus
使用现用的库:https://github.com/penglongli/gin-metrics.git
按照第三方实现即可:
package mainimport ("github.com/gin-gonic/gin""github.com/penglongli/gin-metrics/ginmetrics"
)func main() {r := gin.Default()// get global Monitor objectm := ginmetrics.GetMonitor()// +optional set metric path, default /debug/metricsm.SetMetricPath("/metrics")// +optional set slow time, default 5sm.SetSlowTime(10)// +optional set request duration, default {0.1, 0.3, 1.2, 5, 10}// used to p95, p99m.SetDuration([]float64{0.1, 0.3, 1.2, 5, 10})// set middleware for ginm.Use(r)r.GET("/product/:id", func(ctx *gin.Context) {"productId": ctx.Param("id"),})})_ = r.Run()
}
第三方还提供了garfana的直方图:

看起来效果挺好
json导入:
{"annotations": {"list": [{"builtIn": 1,"datasource": "-- Grafana --","enable": true,"hide": true,"iconColor": "rgba(0, 211, 255, 1)","name": "Annotations & Alerts","type": "dashboard"}]},"editable": true,"gnetId": null,"graphTooltip": 0,"id": 1,"links": [],"panels": [{"datasource": null,"description": "Application request rate every 5 minutes.","fieldConfig": {"defaults": {"custom": {},"mappings": [],"thresholds": {"mode": "absolute","steps": [{"color": "green","value": null},{"color": "red","value": 80}]}},"overrides": []},"gridPos": {"h": 6,"w": 8,"x": 0,"y": 0},"id": 4,"options": {"reduceOptions": {"calcs": ["mean"],"fields": "","values": false},"showThresholdLabels": false,"showThresholdMarkers": true},"pluginVersion": "7.2.0","targets": [{"expr": "rate(gin_request_total[5m])","interval": "","legendFormat": "","refId": "A"}],"timeFrom": null,"timeShift": null,"title": "PV Rate","type": "gauge"},{"aliasColors": {},"bars": false,"dashLength": 10,"dashes": false,"datasource": "Prometheus","description": "","fieldConfig": {"defaults": {"custom": {}},"overrides": []},"fill": 1,"fillGradient": 0,"gridPos": {"h": 6,"w": 8,"x": 8,"y": 0},"hiddenSeries": false,"id": 2,"legend": {"avg": false,"current": false,"max": false,"min": false,"show": true,"total": false,"values": false},"lines": true,"linewidth": 1,"nullPointMode": "null","options": {"alertThreshold": true},"percentage": false,"pluginVersion": "7.2.0","pointradius": 2,"points": false,"renderer": "flot","seriesOverrides": [],"spaceLength": 10,"stack": false,"steppedLine": false,"targets": [{"expr": "gin_request_total","format": "time_series","instant": false,"interval": "","legendFormat": "{{instance}}","refId": "A"}],"thresholds": [],"timeFrom": null,"timeRegions": [],"timeShift": null,"title": "PV","tooltip": {"shared": true,"sort": 0,"value_type": "individual"},"type": "graph","xaxis": {"buckets": null,"mode": "time","name": null,"show": true,"values": []},"yaxes": [{"format": "short","label": null,"logBase": 1,"max": null,"min": null,"show": true},{"format": "short","label": null,"logBase": 1,"max": null,"min": null,"show": true}],"yaxis": {"align": false,"alignLevel": null}},{"aliasColors": {},"bars": false,"dashLength": 10,"dashes": false,"datasource": null,"fieldConfig": {"defaults": {"custom": {}},"overrides": []},"fill": 1,"fillGradient": 0,"gridPos": {"h": 6,"w": 8,"x": 16,"y": 0},"hiddenSeries": false,"id": 6,"legend": {"avg": false,"current": false,"max": false,"min": false,"show": true,"total": false,"values": false},"lines": true,"linewidth": 1,"nullPointMode": "null","options": {"alertThreshold": true},"percentage": false,"pluginVersion": "7.2.0","pointradius": 2,"points": false,"renderer": "flot","seriesOverrides": [],"spaceLength": 10,"stack": false,"steppedLine": false,"targets": [{"expr": "gin_request_uv_total","interval": "","legendFormat": "{{instance}}","refId": "A"}],"thresholds": [],"timeFrom": null,"timeRegions": [],"timeShift": null,"title": "UV","tooltip": {"shared": true,"sort": 0,"value_type": "individual"},"type": "graph","xaxis": {"buckets": null,"mode": "time","name": null,"show": true,"values": []},"yaxes": [{"format": "short","label": null,"logBase": 1,"max": null,"min": null,"show": true},{"format": "short","label": null,"logBase": 1,"max": null,"min": null,"show": true}],"yaxis": {"align": false,"alignLevel": null}},{"aliasColors": {},"bars": false,"dashLength": 10,"dashes": false,"datasource": null,"fieldConfig": {"defaults": {"custom": {},"unit": "Bps"},"overrides": []},"fill": 1,"fillGradient": 0,"gridPos": {"h": 8,"w": 15,"x": 0,"y": 6},"hiddenSeries": false,"id": 12,"legend": {"avg": false,"current": false,"max": false,"min": false,"show": true,"total": false,"values": false},"lines": true,"linewidth": 1,"nullPointMode": "null","options": {"alertThreshold": true},"percentage": false,"pluginVersion": "7.2.0","pointradius": 2,"points": false,"renderer": "flot","seriesOverrides": [],"spaceLength": 10,"stack": false,"steppedLine": false,"targets": [{"expr": "rate(gin_request_body_total[5m])","interval": "","legendFormat": "{{instance}}-in","refId": "A"},{"expr": "rate(gin_response_body_total[5m])","interval": "","legendFormat": "{{instance}}-out","refId": "B"}],"thresholds": [],"timeFrom": null,"timeRegions": [],"timeShift": null,"title": "Traffic In-Out","tooltip": {"shared": true,"sort": 0,"value_type": "individual"},"type": "graph","xaxis": {"buckets": null,"mode": "time","name": null,"show": true,"values": []},"yaxes": [{"format": "Bps","label": null,"logBase": 1,"max": null,"min": null,"show": true},{"format": "bytes","label": null,"logBase": 1,"max": null,"min": null,"show": true}],"yaxis": {"align": false,"alignLevel": null}},{"cacheTimeout": null,"datasource": null,"fieldConfig": {"defaults": {"custom": {"align": null,"filterable": false},"mappings": [],"thresholds": {"mode": "absolute","steps": [{"color": "blue","value": null},{"color": "green","value": 80}]},"unit": "none"},"overrides": []},"gridPos": {"h": 8,"w": 9,"x": 15,"y": 6},"id": 10,"interval": null,"links": [],"options": {"displayMode": "basic","orientation": "horizontal","reduceOptions": {"calcs": ["last"],"fields": "","values": false},"showUnfilled": true},"pluginVersion": "7.2.0","targets": [{"expr": "sum by(uri, instance) (gin_uri_request_total)","format": "time_series","instant": false,"interval": "","intervalFactor": 1,"legendFormat": "{{instance}}-{{uri}}","refId": "A"}],"timeFrom": null,"timeShift": null,"title": "URI Request","type": "bargauge"},{"aliasColors": {},"breakPoint": "50%","cacheTimeout": null,"combine": {"label": "Others","threshold": 0},"datasource": null,"decimals": null,"fieldConfig": {"defaults": {"custom": {"align": null,"filterable": false},"mappings": [],"thresholds": {"mode": "absolute","steps": [{"color": "blue","value": null},{"color": "green","value": 80}]},"unit": "none"},"overrides": []},"fontSize": "80%","format": "none","gridPos": {"h": 7,"w": 7,"x": 0,"y": 14},"id": 13,"interval": null,"legend": {"show": true,"values": true},"legendType": "Right side","links": [],"nullPointMode": "connected","pieType": "pie","pluginVersion": "7.2.0","strokeWidth": 1,"targets": [{"expr": "sum by(method, instance) (gin_uri_request_total)","format": "time_series","instant": false,"interval": "","intervalFactor": 1,"legendFormat": "{{instance}}-{{method}}","refId": "A"}],"timeFrom": null,"timeShift": null,"title": "Method","type": "grafana-piechart-panel","valueName": "current"},{"aliasColors": {},"bars": false,"dashLength": 10,"dashes": false,"datasource": null,"fieldConfig": {"defaults": {"custom": {},"unit": "s"},"overrides": []},"fill": 1,"fillGradient": 0,"gridPos": {"h": 7,"w": 17,"x": 7,"y": 14},"hiddenSeries": false,"id": 16,"legend": {"avg": false,"current": false,"max": false,"min": false,"show": true,"total": false,"values": false},"lines": true,"linewidth": 1,"nullPointMode": "null","options": {"alertThreshold": true},"percentage": false,"pluginVersion": "7.2.0","pointradius": 2,"points": false,"renderer": "flot","seriesOverrides": [],"spaceLength": 10,"stack": false,"steppedLine": false,"targets": [{"expr": "histogram_quantile(0.95, sum (rate(gin_request_duration_bucket[5m])) by (le, instance))","interval": "","legendFormat": "p95","refId": "A"},{"expr": "histogram_quantile(0.99, sum (rate(gin_request_duration_bucket[5m])) by (le, instance))","interval": "","legendFormat": "p99","refId": "B"},{"expr": "sum (gin_request_duration_sum) / sum(gin_request_duration_count)","interval": "","legendFormat": "avg","refId": "C"}],"thresholds": [],"timeFrom": null,"timeRegions": [],"timeShift": null,"title": "Request Duration","tooltip": {"shared": true,"sort": 0,"value_type": "individual"},"type": "graph","xaxis": {"buckets": null,"mode": "time","name": null,"show": true,"values": []},"yaxes": [{"format": "s","label": null,"logBase": 1,"max": null,"min": null,"show": true},{"format": "bytes","label": null,"logBase": 1,"max": null,"min": null,"show": true}],"yaxis": {"align": false,"alignLevel": null}},{"aliasColors": {},"breakPoint": "50%","cacheTimeout": null,"combine": {"label": "Others","threshold": 0},"datasource": null,"decimals": null,"description": "","fieldConfig": {"defaults": {"custom": {"align": null,"filterable": false},"mappings": [],"thresholds": {"mode": "absolute","steps": [{"color": "blue","value": null},{"color": "green","value": 80}]},"unit": "none"},"overrides": []},"fontSize": "80%","format": "none","gridPos": {"h": 5,"w": 7,"x": 0,"y": 21},"id": 14,"interval": null,"legend": {"show": true,"values": true},"legendType": "Right side","links": [],"nullPointMode": "connected","pieType": "pie","pluginVersion": "7.2.0","strokeWidth": 1,"targets": [{"expr": "sum by(code, instance) (gin_uri_request_total)","format": "time_series","instant": false,"interval": "","intervalFactor": 1,"legendFormat": "{{instance}}-{{code}}","refId": "A"}],"timeFrom": null,"timeShift": null,"title": "Code","type": "grafana-piechart-panel","valueName": "current"},{"cacheTimeout": null,"datasource": null,"fieldConfig": {"defaults": {"custom": {"align": null,"filterable": false},"mappings": [],"thresholds": {"mode": "absolute","steps": [{"color": "blue","value": null},{"color": "green","value": 80}]},"unit": "none"},"overrides": []},"gridPos": {"h": 5,"w": 17,"x": 7,"y": 21},"id": 19,"interval": null,"links": [],"options": {"displayMode": "basic","orientation": "horizontal","reduceOptions": {"calcs": ["last"],"fields": "","values": false},"showUnfilled": true},"pluginVersion": "7.2.0","targets": [{"expr": "sum by(uri, instance) (gin_slow_request_total)","format": "time_series","instant": false,"interval": "","intervalFactor": 1,"legendFormat": "{{instance}}-{{uri}}","refId": "A"}],"timeFrom": null,"timeShift": null,"title": "Slow Request(default 5s)","type": "bargauge"}],"refresh": "5s","schemaVersion": 26,"style": "dark","tags": [],"templating": {"list": []},"time": {"from": "now-1h","to": "now"},"timepicker": {},"timezone": "","title": "Gin Application Metrics","uid": "FDB061FMz","version": 11
}
如果直方图报错Panel plugin not found: grafana-piechart-panel
那就给garfana安装插件
下载安装后放到插件目录/var/lib/grafana/plugins后重启grafana就可以了。
wget  https://grafana.com/api/plugins/grafana-piechart-panel/versions/latest/download -O grafana-piechart-panel.zip
unzip grafana-piechart-panel.zip
mv grafana-piechart-panel grafana_data/plugins/
chown -R 472:472 *
docker restart grafana
把程序放到自己的服务器中 多写几条get post命令进行测试:
测试结果: