KaiwuDB 监控组件及辅助 SQL 调优介绍

一、介绍
KaiwuDB 具备完善的行为数据采集功能,此功能要求 KaiwuDB 数据库系统 C/E/T 端不同进程的不同维度的指标采集功能十分完善;在不同进程完成指标采集后,会通过 Opentelemetry 和 Collector 将指标存入 Prometheus,以便查找展示。
Opentelemetry 是一个用于跨多个服务和系统进行分布式跟踪和性能监测的工具,可以帮助收集、记录和分析应用程序的各种数据。
Opentelemetry Collector 是其中的一个组件,它提供了一个通用的数据收集器,可以从多个数据源中收集和转换数据,并将其发送到多个目标存储或分析平台。
1. Opentelemetry Collector 的主要功能
-
数据收集:Opentelemetry Collector 可从多个数据源收集数据,包括 OpenTracing、OpenCensus、Jaeger、Zipkin 和 Prometheus 等数据源;
-
数据转换:Opentelemetry Collector 可以将从不同来源收集的数据转换为一致的格式,以便于传输、存储和分析;
-
数据导出:Opentelemetry Collector 可以将已转换的数据导出到多个目标存储或分析平台,包括 Kafka、AWS S3、Google Cloud Storage、Elasticsearch、Prometheus 和 Zipkin 等。
2. Opentelemetry Collector 的获取
Opentelemetry Collector 是一个开源项目,可以在 githhub 中查看并获取到源码及发行版 https://github.com/open-telemetry/opentelemetry-collector
git clone git@github.com:open-telemetry/opentelemetry-collector.git也可通过 docker 拉取镜像:
docker pull otel/opentelemetry-collector:0.78.0二、监控使用
Opentelemetry Collector 可以对数据库进行监控,以收集关于数据库性能和行为方面的指标。它可以使用 OpenTelemetry API 或可用的数据库驱动程序进行操作,以收集以下指标:
-
响应时间:可以测量数据库请求的响应时间,从而确定查询的性能和效率;
-
错误率:可以识别数据库是否遇到错误,以及有多少请求在请求过程中失败;
-
连接数:可以测量数据库上打开的连接数量,以确定有多少客户端正在连接;
-
缓存效率:可以了解数据库是否使用缓存,并确定缓存的命中率;
-
读写比率:可以了解有多少数据库请求是读操作和写操作。
通过 Opentelemetry Collector 监控数据库,可以及时发现数据库性能方面的问题,如响应时间长、错误率高等,并进行诊断和优化。此外,它还可以与其他组件一起使用,如有些业务数据需要查询数据库,就可以将这些指标集成到整个业务监控体系中,以获取更完整的业务性能指标。
Opentelemetry 中指标采集的流程如下:

MetricReader 会周期性调用 MetricCollector 的 Collect 方法, MetricCollector 的 Collect 方法中会遍历 MeterProvider 中所有指标并将其打包返回给 MetricReader,随后通过 Expor 方法将指标通过 http 协议发送到 OpenTelemetry-Collector。
Opentelemetry Collector 支持从 Prometheus 数据源中收集指标数据,并将其转换为 OpenTelemetry 标准的格式,以便于进行跨平台和跨语言的应用。以下是如何使用 Opentelemetry Collector 收集和处理 Prometheus 数据源的指标数据的步骤:
1. 配置 Opentelemetry Collector
Opentelemetry Collector 的配置可以由以下几个部分组成:
-
Receiver:接收器,即 Collector 接收的数据源的形式;
-
Processor:在 Receiver 和 Exportor 之间执行的类似于处理数据的插件;
-
Exportor:导出器,即 Collector 输出的数据源的形式;
-
Service:部分用于配置 OpenTelemetry Collector 根据上述的配置会启用那些特性。
2. 启动 Opentelemetry Collector
启动 Opentelemetry Collector 时,可以使用命令行或配置文件来指定要收集和导出的数据源和目标存储或分析平台。
# start collector using the configuration file
$ ./otelcol --config collector-config.yaml
也可使用 docker 启动镜像:
ocker run -v $(pwd)/config.yaml:/etc/otelcol-contrib/config.yaml otel/opentelemetry-collector:0.78.0在客户端应用程序中生成指标数据为了将指标数据发送到 Opentelemetry Collector,客户端应用程序需要使用适当的 API 和配置来生成指标数据。以下是使用 C++ 应用程序发送指标数据的示例代码:
#include <opentelemetry/sdk/metrics/meter.h>
#include <opentelemetry/exporters/otlp/otlp_http/otlp_http_exporter.h>
#include <opentelemetry/sdk/metrics/controller.h>
#include <opentelemetry/sdk/metrics/processormetrics.h>
#include <iostream>
using namespace opentelemetry::sdk::metrics;
using namespace opentelemetry::exporter::otlphttp;int main()
{try{// Create a metric exporterOtlpHttpExporterOptions opts;opts.url = "http://localhost:4317/v1/metrics";auto exporter = std::unique_ptr<OtlpHttpExporter>(new OtlpHttpExporter(opts));// Create a processorstd::unique_ptr<Processor> processor(new Processor());// Create a controllerauto controller = std::make_shared<Controller>(std::move(processor), std::chrono::system_clock::now());// Create a meterauto meter = controller->provider().GetMeter("example");// Define a counter metricauto counter = meter->NewIntCounter("example_counter", "counts", "1");// Record some datafor (int i = 0; i < 10; i++){counter->Add(i, {{"key", "value"}});}// Shutdown the controllercontroller->Shutdown().wait();}catch (const std::exception& e){std::cerr << "Exception caught: " << e.what() << std::endl;return 1;}return 0;
}
在此示例中,使用 OpenTelemetry C++ SDK 创建了一个指标 exporter、processor 和 controller,并使用 meter 创建了一个 counter 指标。然后,它使用 Add 方法记录了 10 次计数值,并将指标数据发送到了 OpenTelemetry Collector 中。
3. 分析和可视化数据
通过 Opentelemetry Collector,我们可以将 Prometheus 数据源的指标数据导出到多个目标存储或分析平台。以下是将指标数据导出到 Prometheus 的示例配置:
receivers:prometheus:config:scrape_configs:- job_name: 'my-service'scrape_interval: 30sstatic_configs:- targets: ['localhost:9080/metrics'] # replace with your collector's target
processors:batch:
exporters:prometheus:namespace: my-serviceendpoint: '0.0.0.0:8080' # replace with your prometheus server's endpoint
service:pipelines:metrics:receivers: [prometheus]processors: [batch]exporters: [prometheus]
在此配置文件中,我们定义了一个名为“prometheus”的导出器,并设置了导出命名空间和 Prometheus 服务器的端点地址。通过将指标数据导出到 Prometheus,我们可以使用 Prometheus 的查询语言 PromQL 来进行数据分析和可视化。
在 KaiwuDB 的监控中,使用了 Opentelemetry 的 Metrics API,创建 Gauge 和Counter的方法,并将其注册到 opentelemetry 的 MeterProvider 中。同时,使用 otlp exporter 将指标数据发送到远程的 OTLP 收集器。
opentelemetry::exporter::otlp::OtlpHttpMetricExporterOptions opts;
int interval, timeout;
ZString ot_url = GetSysConfig("METRICS_PLUGIN", "url");
ZString interval_s = GetSysConfig("METRICS_PLUGIN", "interval");
ZString timeout_s = GetSysConfig("METRICS_PLUGIN", "timeout");
interval = atoi(interval_s.c_str());
timeout = atoi(timeout_s.c_str());
if (ot_url != "")
{opts.url = ot_url;
}
else
{opts.url = "http://localhost:4318/v1/metrics";
}
// Create OTLP exporter instance
auto exporter = otlp::OtlpHttpMetricExporterFactory::Create(opts);
// Initialize and set the global MeterProvider
metric_sdk::PeriodicExportingMetricReaderOptions options;
options.export_interval_millis = std::chrono::milliseconds(interval);
options.export_timeout_millis = std::chrono::milliseconds(timeout);// Initialize the reader
std::unique_ptr<metric_sdk::MetricReader> reader{new metric_sdk::PeriodicExportingMetricReader(std::move(exporter), options)};
// Initialize the provider
auto resource_attributes = opentelemetry::sdk::resource::ResourceAttributes{{"service.name", "service"}};
auto resource = opentelemetry::sdk::resource::Resource::Create(resource_attributes);
auto provider = std::shared_ptr<metrics_api::MeterProvider>(new metric_sdk::MeterProvider(std::unique_ptr<opentelemetry::v1::sdk::metrics::ViewRegistry>(new opentelemetry::v1::sdk::metrics::ViewRegistry()), resource));
auto p = std::static_pointer_cast<metric_sdk::MeterProvider>(provider);
p->AddMetricReader(std::move(reader));
metrics_api::Provider::SetMeterProvider(provider);
上述代码在 KaiwuDB 中用于配置和初始化 OpenTelemetry 的 OTLP exporter 来实现将指标数据发送到指定的后端服务。
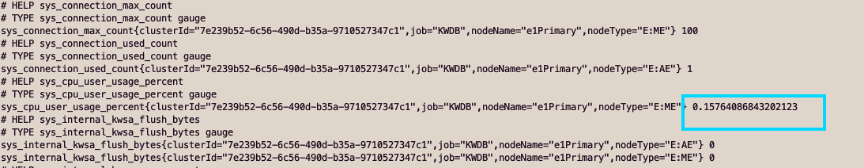
在启动Opentelemetry Collector后,即可通过定义好的 url-http://localhost:4318/v1/metrics 来查询相关监控数据。KaiwuDB 中获取到的为 Promtheus 数据,其获取示例如下:
# HELP sys_connection_max_count
# TYPE sys_connection_max_count gauge
sys_connection_max_count{clusterId="60a10600-497b-4186-88d0-bacafe0a1857",job="KWDB",nodeName="e1Primary",nodeType="E:ME"} 100
# HELP sys_connection_used_count
# TYPE sys_connection_used_count gauge
sys_connection_used_count{clusterId="60a10600-497b-4186-88d0-bacafe0a1857",job="KWDB",nodeName="e1Primary",nodeType="E:AE"} 0
三、监控指标对于 SQL 的调优作用
在 KaiwuDB 中,针对性能的监控有如下指标

在连接 KaiwuDB 后,通过 http://localhost:4318/v1/metrics 获取到相关的监控指标。

使用如下 SQL 进行查询:
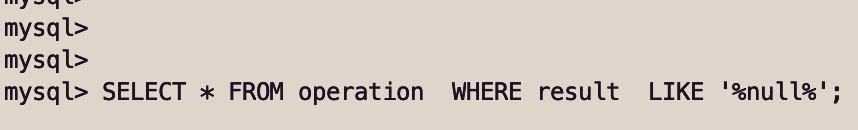
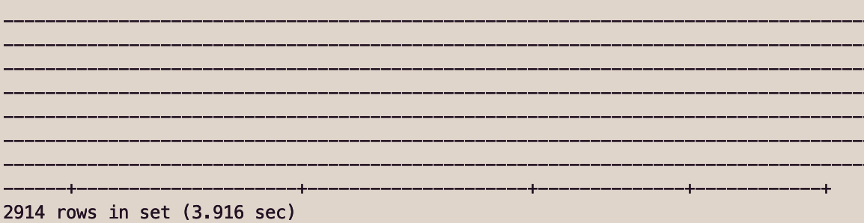
再次查询监控指标可以发现 CPU 的使用率明显升高。
因为这个 SQL 语句使用了通配符(%)来模糊匹配列中的字符串,如果该列中的数据量很大,这个查询可能会导致数据库 CPU 使用率升高,因为它需要在整个列中搜索匹配项。
所以我们可以通过使用添加索引或使用前缀通配符来优化 SQL。
ALTER TABLE operation ADD INDEX idx_result (result);再次使用 SQL 进行查询后可以看到所用时间明显减少,同时,监控数据中的 CPU 使用率也有所下降。


四、总结
Opentelemetry Collector 是一个非常强大的工具,可以帮助用户轻松地收集、转换和导出分布式跟踪和性能监测数据。使用 Opentelemetry Collector,用户可以更好地了解他们的应用程序和系统的性能,并为业务决策提供更好的数据支持。
通过使用 OpenTelemetry 来收集和分析 SQL 指标,可以轻松地监控每个 SQL 查询的执行效率,并识别潜在的性能问题。这有助于优化查询性能并提高应用程序的性能。