echarts 几千条分钟级别在小时级别图标上展示
- 需求背景
- 解决效果
- ISQQW代码地址
- strategyChart.vue
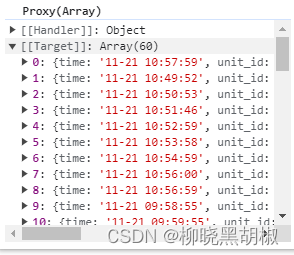
需求背景
需要实现 秒级数据几千条在图表上显示,(以下是 设计图表上是按小时界别显示数据,后端接口为分钟级别数据)
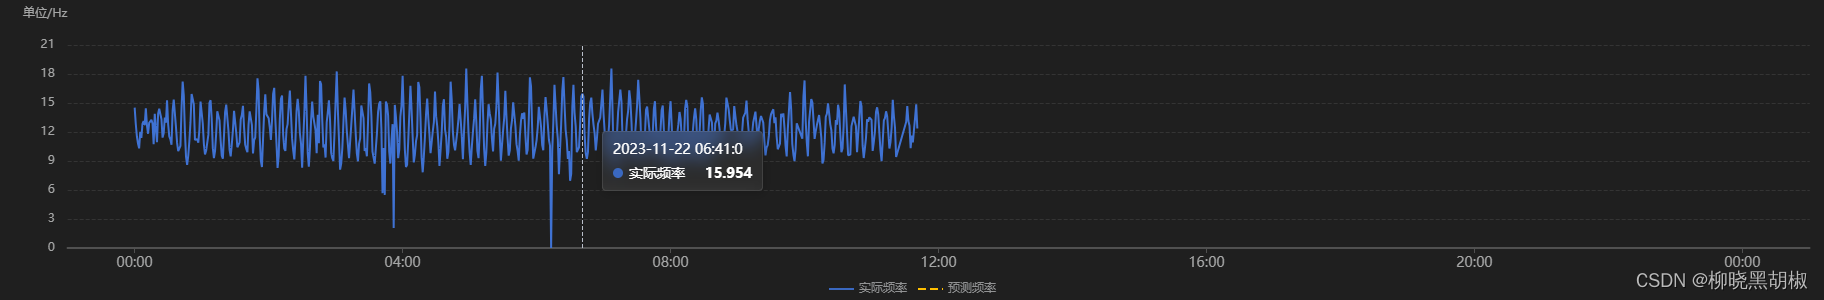
解决效果
ISQQW代码地址
链接
strategyChart.vue
<!--/**
* @author: liuk
* @date: 2023/11/21
* @describe: 描述
* @email:1229223630@qq.com
*/-->
<template><div ref="chatDom" class="strategyChart"></div>
</template><script lang="ts" setup>
import {ref, onMounted, watch, nextTick} from "vue"
import * as echarts from 'echarts'// Props
const props = defineProps(['data', 'type'])let myChart = null // Vue3 使用 proxy 对象代理,而 echarts 则使用了大量的全等(===), 对比失败从而导致了bug。
const chatDom = ref(null)watch(() => props.data, (data: any) => {nextTick(() => {const option = myChart.getOption()myChart.clear()myChart.setOption(renderFn(option, data, props.type))})
}, {deep: true})onMounted(() => {drawChart()window.addEventListener('resize', () => {const option = myChart.getOption()myChart.clear()myChart.setOption(renderFn(option, props.data, props.type))}, {passive: true});
})const renderFn = (option, data, type) => {switch (type) {case 1:option.legend[0].data = ['当前二供温', '目标二供温']option.yAxis[0].name = '单位/℃'option.series[0].name = '当前二供温'option.series[0].data = data.tt211_valueoption.series[0].color = '#3A68C0'option.series[1].name = '目标二供温'option.series[1].data = data.tt211_balanced_forecastoption.series[1].color = '#FFBF00'option.series[1].lineStyle.type = 'dashed'return optioncase 2:option.legend[0].data = ['反馈阀开度', '设定阀开度', "预测阀开度"]option.yAxis[0].name = '单位/%'option.series[0].name = '反馈阀开度'option.series[0].data = data.cov121_valueoption.series[0].color = '#3A68C0'option.series[1].name = '设定阀开度'option.series[1].data = data.cov121_forecastsetoption.series[1].color = '#FFBF00'option.series[2].name = '预测阀开度'option.series[2].data = data.cip121_hz_forecastoption.series[2].color = '#FFBF00'option.series[3] = {name: '',symbol: 'image://',type: 'line',color: '2c2c2c',showSymbol: false,connectNulls: false,data: curData,areaStyle: {color: '#2c2c2c'},lineStyle: {width: 2,type: 'dotted'},}return optioncase 3:option.legend[0].data = ['实际频率', '预测频率']option.yAxis[0].name = '单位/Hz'option.series[0].name = '实际频率'option.series[0].data = data.cip121_hzoption.series[0].color = '#3A68C0'option.series[1].name = '预测频率'option.series[1].data = data.cip121_hz_forecastoption.series[1].color = '#FFBF00'option.series[1].lineStyle.type = 'dashed'return option}
}
// 当前天 24小时数据
const curData = new Array(27).fill([]).map((_, i) => {const cur0Date = new Date(new Date().toLocaleDateString()).setHours(0) // 当天0点时间戳 秒级return [cur0Date + (i - 1) * 60 * 60 * 1000, '-']
})
const drawChart = () => {let chartDom = chatDom.valueif (chartDom == null) {return}echarts.dispose(chartDom)myChart = echarts.init(chartDom)const option = {legend: {bottom: 0,data: [],textStyle: {color: '#929394'},},tooltip: {trigger: 'axis',borderColor: 'rgba(255,255,255,.1)',backgroundColor: 'rgba(149, 149, 149, 0.11)',extraCssText: '0px 2px 8px 0px rgba(0,0,0,0.3); backdrop-filter: blur(8px);',textStyle: {color: '#fff'},},grid: {left: '2.5%',top: '15%',right: '0.8%',bottom: '10%',containLabel: true},xAxis: [{type: 'time',show: true,axisLine: {show: true,lineStyle: {width: 2,color: 'rgba(80,80,80,1)'}},axisTick: {show: true,alignWithLabel: true, // 将刻度线与标签对齐},axisLabel: {color: 'rgba(165,166,166,1)',fontSize: '14',formatter: (val) => {const date = new Date(val)const isNow = date.getHours() === new Date().getHours()return isNow ? 'now' : String(date.getHours()).padStart(2, '0') + ':00'}},axisPointer: {label: {formatter: function (params) {const date = new Date(params.value)const y = date.getFullYear()const m = date.getMonth() + 1 < 10 ? ('0' + date.getMonth() + 1) : date.getMonth() + 1const d = date.getDate() < 10 ? ('0' + date.getDate()) : date.getDate()const hours = date.getHours() < 10 ? ('0' + date.getHours()) : date.getHours()const minutes = date.getMinutes() < 10 ? ('0' + date.getMinutes()) : date.getMinutes()var seconds = date.getSeconds()return `${y}-${m}-${d}` + ` ${hours}:${minutes}:${seconds}`}}},}],yAxis: [{name: '单位/%',type: 'value',show: true,offset: 5,nameTextStyle: {padding: [0, 35, 10, 0],color: 'rgba(165,166,166,1)',fontSize: '12',},splitLine: {show: true,lineStyle: {type: 'dashed',color: 'rgba(52,52,52,1)'}},axisLabel: {color: 'rgba(165,166,166,1)',fontSize: '12',},}],series: [{name: '反馈阀开度',symbol: 'image://',type: 'line',color: "rgba(255,191,0,1)",showSymbol: false,connectNulls: false,data: curData,areaStyle: {color: 'rgba(255,191,0,0)'},lineStyle: {width: 2,type: 'solid'},},{name: '设定阀开度',symbol: 'image://',type: 'line',color: 'red',showSymbol: false,connectNulls: false,data: curData,areaStyle: {color: 'rgba(255,191,0,0)'},lineStyle: {width: 2,type: 'solid'},},{name: '',symbol: 'image://',type: 'line',color: '2c2c2c',showSymbol: false,connectNulls: false,data: curData,areaStyle: {color: '2c2c2c'},lineStyle: {width: 2,type: 'dotted'},},]}option && myChart.setOption(option)
}
</script><style lang="scss" scoped>
.strategyChart {width: 100%;height: 100%;margin-top: 5px;
}
</style>
<style lang="scss">
.detailChat-popup {overflow: hidden;margin: 3px 10px;.top {margin-bottom: 16px;}.item {display: flex;align-items: center;margin: 10px 0;&:last-child {margin-bottom: 0;}.icon {display: inline-block;width: 12px;text-align: center;margin-right: 10px;}.name {margin-right: 20px;}}
}
</style>