Echarts大屏可视化_05 折线图的定制开发
继续跟着@pink老师学习Echarts相关内容!!!!!!!!!
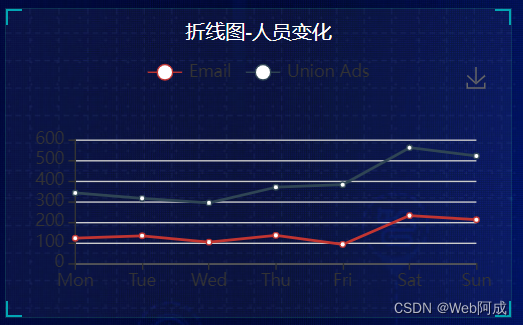
折线图1
1.引入
折线图选取示例地址 标题没有用到就给他删了
直接引入
注意这里是line下面的chart 获取dom元素一定不要错误
(function () {// 实例化对象var myChart = echarts.init(document.querySelector(".line .chart"));// 指定配置项和数据let option = {tooltip: {trigger: "axis",},legend: {data: ["Email", "Union Ads", "Video Ads", "Direct", "Search Engine"],},grid: {left: "3%",right: "4%",bottom: "3%",containLabel: true,},toolbox: {feature: {saveAsImage: {},},},xAxis: {type: "category",boundaryGap: false,data: ["Mon", "Tue", "Wed", "Thu", "Fri", "Sat", "Sun"],},yAxis: {type: "value",},series: [{name: "Email",type: "line",stack: "Total",data: [120, 132, 101, 134, 90, 230, 210],},{name: "Union Ads",type: "line",stack: "Total",data: [220, 182, 191, 234, 290, 330, 310],}],};// 把配置项给实例对象myChart.setOption(option);
})(); 
2.定制开发
1.基本样式修改
有了柱状图的经验,大多数基本的样式直接修改就完事了
(function () {// 实例化对象var myChart = echarts.init(document.querySelector(".line .chart"));// 指定配置项和数据let option = {// 通过color修改两条线的颜色color: ["#00f2f1", "#ed3f35"],tooltip: {trigger: "axis",},legend: {// 如果series 里面设置了name,就不用写data了// 图例颜色textStyle: {color: "#4c9bfd",},// 图例距离右边10%  一定要加引号 不能遗漏right: "10%",// data: ["新增粉丝", "新增游客"],},grid: {top: "20%",left: "3%",right: "4%",bottom: "3%",show: true, //显示边框borderColor: "#012f4a", //边框颜色containLabel: true, //包含刻度文字在内},xAxis: {type: "category",boundaryGap: false, //去除轴内间距data: ["1月","2月","3月","4月","5月","6月","8月","9月","10月","11月","12月",],// 去除刻度axisTick: {show: false,},// 文字颜色axisLabel: {color: "#4c9bfd",},// x轴线的颜色axisLine: {show: false,},},yAxis: {type: "value",// 去除刻度axisTick: {show: false,},// 文字颜色axisLabel: {color: "#4c9bfd",},// 去除轴线axisLine: {show: false,},// 分割线颜色splitLine: {lineStyle: {color: "#012f4a",},},},series: [{name: "新增粉丝",type: "line",data: [24, 40, 101, 134, 90, 230, 210, 203, 120, 230, 210, 120],// 折现修饰为圆滑smooth: true,},{name: "新增游客",type: "line",data: [40, 60, 191, 324, 290, 330, 310, 210, 180, 200, 180, 79],// 折现修饰为圆滑smooth: true,},],};// 把配置项给实例对象myChart.setOption(option);// 侦听屏幕的变化,让图表跟着变化window.addEventListener("resize", function () {myChart.resize();});
})(); 
2. 折线图Tab切换分析+实现
我们如果想加一个tab切换标签 比如想看 2022 和 2023年的变化 如何做到呢??
样式自己写一下
1.HTML
<h2>折线图-人员变化<a href="javascript:;">2022</a><a href="javascript:;">2023</a>
</h2>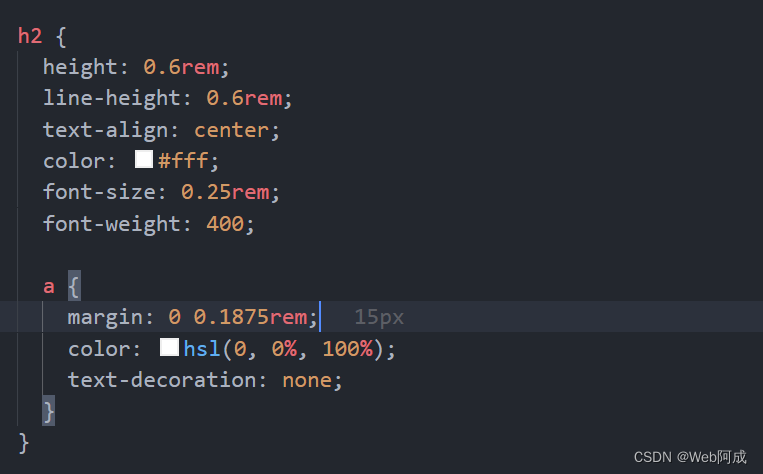

数据应该是后端发送过来的,这里编一个。
思路是,点击2022 或者 2023 的时候 将series中的数据 用后端传过来的数据赋值就完成了。后端的格式应该是数组类型的。
2.jQuery获取到点击事件
不要忘记引入jQuery 并且引入jQuery必须在index的上面。 不然会提示$找不到,因为脚本是按照从上往下的顺序加载的。
不知道jQuery的可以看我的jQuery精简教程。

//tab栏切换效果$(".line h2").on("click", "a", function () {alert("我点击了");});
我们利用索引查看点击的是哪一个
//tab栏切换效果$(".line h2").on("click", "a", function () {// 查看点击的索引号console.log($(this).index());});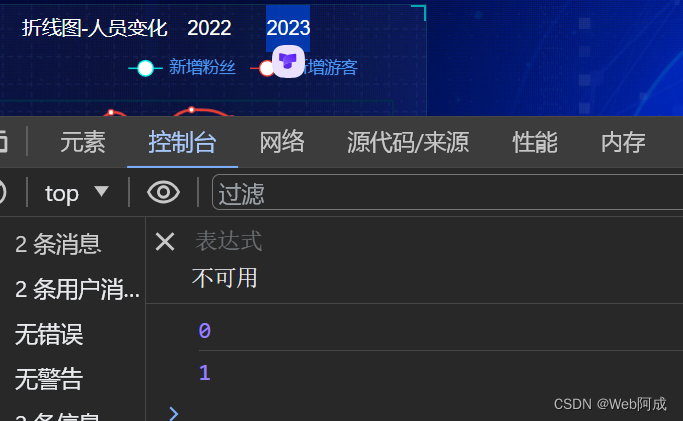
3.构造数据 点击获取数据
// 假数据 其实应该是后端返回var yearData = [{year: "2022",data: [[24, 40, 101, 134, 90, 230, 210, 203, 120, 230, 210, 120],[40, 60, 191, 324, 290, 330, 310, 210, 180, 200, 180, 79],],},{year: "2023",data: [[124, 140, 101, 134, 90, 230, 210, 203, 120, 230, 210, 120],[140, 160, 191, 324, 290, 330, 310, 210, 180, 200, 180, 79],],},]; //tab栏切换效果$(".line h2").on("click", "a", function () {// 查看点击的索引号// console.log($(this).index());//点击a之后 根据当前a的索引号 找到对应的yearData的相关对象console.log(yearData[$(this).index()]);});
4. 将获得的数据赋值给option中的series
注意 更换完数据并不会达到切换的效果,因为没有调用渲染函数,所以我们应该重新构建一下图表
//tab栏切换效果$(".line h2").on("click", "a", function () {// 查看点击的索引号// console.log($(this).index());//点击a之后 根据当前a的索引号 找到对应的yearData的相关对象// console.log(yearData[$(this).index()]);option.series[0].data = yearData[$(this).index()].data[0];option.series[1].data = yearData[$(this).index()].data[1];// 重新渲染myChart.setOption(option);});
5.改变原始数据
将原始数据改变,就跟开发调用后端接口一样了。
series: [{name: "新增粉丝",type: "line",data: yearData[0].data[0],// 折现修饰为圆滑smooth: true,},{name: "新增游客",type: "line",data: yearData[0].data[1],// 折现修饰为圆滑smooth: true,},], 
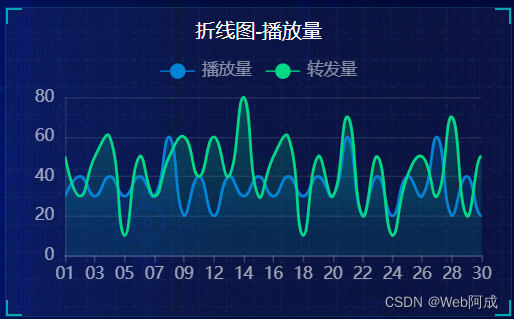
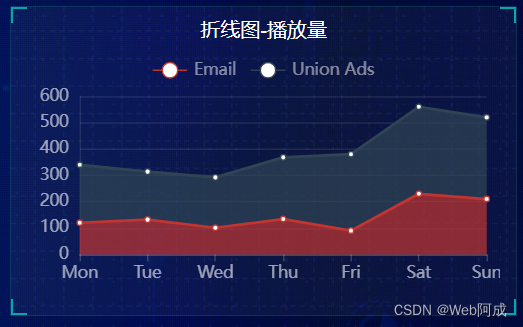
折线图2
1.引入
Echarts示例地址 从这个网站复制数据

// 折线图2 模块制作
(function () {// 实例化对象var myChart = echarts.init(document.querySelector(".line2 .chart"));// 指定配置项和数据var option = {tooltip: {trigger: "axis",},legend: {data: ["Email", "Union Ads", "Video Ads", "Direct", "Search Engine"],},grid: {left: "3%",right: "4%",bottom: "3%",containLabel: true,},xAxis: [{type: "category",boundaryGap: false,data: ["Mon", "Tue", "Wed", "Thu", "Fri", "Sat", "Sun"],},],yAxis: [{type: "value",},],series: [{name: "Email",type: "line",stack: "Total",areaStyle: {},emphasis: {focus: "series",},data: [120, 132, 101, 134, 90, 230, 210],},{name: "Union Ads",type: "line",stack: "Total",areaStyle: {},emphasis: {focus: "series",},data: [220, 182, 191, 234, 290, 330, 310],},],};// 把配置项给实例对象myChart.setOption(option);
})();

2.定制开发
1.基本样式修改
// 折线图2 模块制作
(function () {// 实例化对象var myChart = echarts.init(document.querySelector(".line2 .chart"));// 指定配置项和数据var option = {tooltip: {trigger: "axis",},legend: {// 位置调整top: "0%",data: ["Email", "Union Ads", "Video Ads", "Direct", "Search Engine"],// 修改图例组件的文字颜色textStyle: {color: "rgba(255, 255, 255, .5)",fontSize: 12,},},// 调整边距grid: {top: "30",left: "10",right: "10",bottom: "10",containLabel: true,},xAxis: [{type: "category",boundaryGap: false,data: ["Mon", "Tue", "Wed", "Thu", "Fri", "Sat", "Sun"],// 文本颜色axisLabel: {textStyle: {color: "rgba(255, 255, 255, .6)",fontSize: 12,},},// x轴线的颜色axisLine: {lineStyle: {color: "rgba(255, 255, 255, .2)",},},},],yAxis: [{type: "value",// 不显示刻度axisTick: { show: false },// x轴线的颜色axisLine: {lineStyle: {color: "rgba(255, 255, 255, .1)",},},// 文本颜色axisLabel: {textStyle: {color: "rgba(255, 255, 255, .6)",fontSize: 12,},},// 分割线颜色splitLine: {lineStyle: {color: "rgba(255, 255, 255, .1)",},},},],series: [{name: "Email",type: "line",stack: "Total",areaStyle: {},emphasis: {focus: "series",},data: [120, 132, 101, 134, 90, 230, 210],},{name: "Union Ads",type: "line",stack: "Total",areaStyle: {},emphasis: {focus: "series",},data: [220, 182, 191, 234, 290, 330, 310],},],};// 把配置项给实例对象myChart.setOption(option);
})();
2. 修改两个线模块配置
1.填充颜色设置
建议直接复制代码
// 填充区域areaStyle: {// 渐变色,只需要复制即可color: new echarts.graphic.LinearGradient(0,0,0,1,[{offset: 0,color: "rgba(1, 132, 213, 0.4)", // 渐变色的起始颜色},{offset: 0.8,color: "rgba(1, 132, 213, 0.1)", // 渐变线的结束颜色},],false),shadowColor: "rgba(0, 0, 0, 0.1)",},
2.拐点配置定制+更换数据
// 折线图2 模块制作
(function () {// 实例化对象var myChart = echarts.init(document.querySelector(".line2 .chart"));// 指定配置项和数据var option = {tooltip: {trigger: "axis",},legend: {// 位置调整top: "0%",data: ["Email", "Union Ads", "Video Ads", "Direct", "Search Engine"],// 修改图例组件的文字颜色textStyle: {color: "rgba(255, 255, 255, .5)",fontSize: 12,},},// 调整边距grid: {top: "30",left: "10",right: "10",bottom: "10",containLabel: true,},xAxis: [{type: "category",boundaryGap: false,data: ["01","02","03","04","05","06","07","08","09","11","12","13","14","15","16","17","18","19","20","21","22","23","24","25","26","27","28","29","30",],// 文本颜色axisLabel: {textStyle: {color: "rgba(255, 255, 255, .6)",fontSize: 12,},},// x轴线的颜色axisLine: {lineStyle: {color: "rgba(255, 255, 255, .2)",},},},],yAxis: [{type: "value",// 不显示刻度axisTick: { show: false },// x轴线的颜色axisLine: {lineStyle: {color: "rgba(255, 255, 255, .1)",},},// 文本颜色axisLabel: {textStyle: {color: "rgba(255, 255, 255, .6)",fontSize: 12,},},// 分割线颜色splitLine: {lineStyle: {color: "rgba(255, 255, 255, .1)",},},},],series: [{name: "Email",type: "line",smooth: true, //折线圆滑// 单独修改线的样式lineStyle: {color: "#0184d5",width: 2,},// 填充区域areaStyle: {// 渐变色,只需要复制即可color: new echarts.graphic.LinearGradient(0,0,0,1,[{offset: 0,color: "rgba(1, 132, 213, 0.4)", // 渐变色的起始颜色},{offset: 0.8,color: "rgba(1, 132, 213, 0.1)", // 渐变线的结束颜色},],false),shadowColor: "rgba(0, 0, 0, 0.1)",},// 拐点设置为小圆点symbol: "circle",symbolSize: 5,showSymbol: false, //开始不显示拐点,鼠标经过显示// 设置拐点颜色以及边框itemStyle: {color: "#0184d5",borderColor: "rgba(221, 220, 107, .1)",borderWidth: 12,},emphasis: {focus: "series",},data: [30, 40, 30, 40, 30, 40, 30, 60, 20, 40, 20, 40, 30, 40, 30, 40, 30,40, 30, 60, 20, 40, 20, 40, 30, 60, 20, 40, 20, 40,],},{name: "Union Ads",type: "line",smooth: true, //折线圆滑// 单独修改线的样式lineStyle: {color: "#0184d5",width: 2,},// 填充区域areaStyle: {// 渐变色,只需要复制即可color: new echarts.graphic.LinearGradient(0,0,0,1,[{offset: 0,color: "rgba(1, 216, 135, 0.4)", // 渐变色的起始颜色},{offset: 0.8,color: "rgba(1, 216, 135, 0.1)", // 渐变线的结束颜色},],false),shadowColor: "rgba(0, 0, 0, 0.1)",},// 拐点设置为小圆点symbol: "circle",symbolSize: 5,showSymbol: false, //开始不显示拐点,鼠标经过显示// 设置拐点颜色以及边框itemStyle: {color: "#00d887",borderColor: "rgba(221, 220, 107, .1)",borderWidth: 12,},emphasis: {focus: "series",},data: [50, 30, 50, 60, 10, 50, 30, 50, 60, 40, 60, 40, 80, 30, 50, 60, 10,50, 30, 70, 20, 50, 10, 40, 50, 30, 70, 20, 50, 10, 40,],},],};// 把配置项给实例对象myChart.setOption(option);// 侦听屏幕的变化,让图表跟着变化window.addEventListener("resize", function () {myChart.resize();});
})();