05. Springboot admin集成Actuator(一)
目录
1、前言
2、Actuator监控端点
2.1、健康检查
2.2、信息端点
2.3、环境信息
2.4、度量指标
2.5、日志文件查看
2.6、追踪信息
2.7、Beans信息
2.8、Mappings信息
3、快速使用
2.1、添加依赖
2.2、添加配置文件
2.3、启动程序
4、自定义端点Endpoint
5、自定义health
6、附录
7、小结
1、前言
Spring Boot Actuator是Spring Boot提供的一个用于监控和管理应用程序的扩展模块。Actuator通过HTTP端点和JMX(Java Management Extensions)提供了一系列功能,包括查看应用程序的运行状况、度量指标、日志、追踪和应用信息。它为开发人员和运维人员提供了方便的手段来监控和管理Spring Boot应用。
2、Actuator监控端点
Actuator提供了一系列内置的端点(EndPoints)用于查看应用程序的运行状况、运行情况、指标等信息。其中主要提供了如下一些端点:
2.1、健康检查
HTTP端点:`/actuator/health`。提供了应用程序的健康状态,包括磁盘空间、数据库连接等信息。健康检查对于监控和负载均衡非常有用。返回的状态包括 UP(正常)、DOWN(异常)和 OUT_OF_SERVICE(维护中)等。
2.2、信息端点
HTTP端点:`/actuator/info`。提供了应用程序的自定义信息,可以在配置文件中定义,用于展示应用的版本、描述等。这些信息通常来源于应用程序的配置文件或构建系统。
2.3、环境信息
HTTP端点:`/actuator/env`。显示应用程序的环境属性,包括配置属性、系统属性等。可以通过添加参数来查看特定属性的值,如:/actuator/env/server.port。
2.4、度量指标
HTTP端点:`/actuator/metrics`。提供了应用程序的度量指标,例如内存使用、线程池状态、HTTP请求等,对性能分析和优化非常有帮助。如:/actuator/metrics/jvm.memory.used。
2.5、日志文件查看
HTTP端点:`/actuator/logfile`。允许查看应用程序的日志文件内容,方便进行故障排除。
2.6、追踪信息
HTTP端点:`/actuator/trace`。提供了应用程序的请求追踪信息,显示HTTP请求的调用链,便于跟踪请求的处理过程。
2.7、Beans信息
HTTP端点:`/actuator/beans`。显示所有在Spring应用程序上下文中注册的Beans信息,包括它们的名称、类型等。
2.8、Mappings信息
HTTP端点:`/actuator/mappings`。 显示所有的URI映射,展示了请求如何被映射到控制器方法上。
3、快速使用
了解了Actuator的各个主要端点以及他们的作用后,我们便可以选择适当的端点作为我们的监控行为,集成到项目中。
基础环境:SpringBoot-2.7.14,JDK-17.0.2。构建基础springboot demo工程。
3.1、添加依赖
<dependency><groupId>org.springframework.boot</groupId><artifactId>spring-boot-starter-actuator</artifactId>
</dependency>
3.2、添加配置文件
spring:application:name: springboot-actuator-demo
server:port: 8080management:server:port: 8081   # 指定了actuator服务端口endpoints:web:exposure:include: '*'    # 表示开启所有端点,如果指定具体多个端点,可以用,隔开。如health,info
3.3、启动程序

启动日志中可以看到启动了actuator端口为8081,且访问路径为/actuator。我们访问下http://localhost:8081/actuator:
可以看到actuator返回了一列指标的访问连接。

接着继续访问给定的连接,实际上就是http://localhost:8081/actuator/端点url。如查看当前JVM内存占用情况,直接访问http://localhost:8081/actuator/metrics/jvm.memory.used

4、自定义端点Endpoint
除了Actuator自带的端点以外,我们还可以自定义所需要的端点。自定义端点需要先了解以下几个注解:
- @Component:注册为一个Spring Bean。
- @Endpoint:声明端点的注解,需要指定id=""属性,标识端点名称。
- @ReadOperation:用于定义读操作,允许获取关于应用程序状态的信息。它对应 HTTP 请求的 GET 方法。通常用于返回只读信息,例如获取应用程序的状态、性能指标等。
- @WriteOperation:用于定义写操作,允许进行应用程序的修改。它对应 HTTP 请求的 POST 方法。通常用于执行会修改应用程序状态的操作,例如重新加载配置、清理缓存等。
- @DeleteOperation:用于定义删除操作,允许进行资源的删除。它对应 HTTP 请求的 DELETE 方法。通常用于执行删除资源的操作,例如关闭数据库连接池、停止某个服务等。
- @Selector:用于@ReadOperation、@WriteOperation、@DeleteOperation标注的 Endpoint 方法时允许传递一些参数。
简单demo:
package com.example.springbootactuator.entpoint;import org.springframework.boot.actuate.endpoint.annotation.*;
import org.springframework.context.annotation.Configuration;
import org.springframework.http.HttpMethod;
import org.springframework.stereotype.Component;import java.util.HashMap;
import java.util.Map;/*** 注意:这里定义的端点名称只能是英文字母+数字,不能有其他字符,甚至下划线也不行。不然会提示 Value must only contain valid chars*/
@Component
@Endpoint(id = "myendpoint", enableByDefault = true)
public class MyEndpoint {@ReadOperationpublic Map<String, Object> endpointMyRead(@Selector String content) {Map<String, Object> customMap = new HashMap<>();customMap.put("httpMethod", HttpMethod.GET.toString());customMap.put("status", "200");customMap.put("content", content);return customMap;}@WriteOperationpublic Map<String, Object> endpointMyWrite() {Map<String, Object> customMap = new HashMap<>();customMap.put("httpMethod", HttpMethod.POST.toString());return customMap;}@DeleteOperationpublic Map<String, Object> endpointMyDelete() {Map<String, Object> customMap = new HashMap<>();customMap.put("httpMethod", HttpMethod.DELETE.toString());return customMap;}
}
运行后查看端点,可以看到多了我们自定义的myendpoint端点名称,同时多了一个可以接收{content}的端点连接,这个就是我们加了@Selector注解,允许接收参数。

来尝试访问下:http://localhost:8081/actuator/myendpoint/hello123123123。可以得到我们返回的map结构。

5、自定义health
我们还可以自定义health,用来检测其健康状态。这个也是我项目中用的比较多的,当时有一个需求是汇总所有的API请求,检测对方的API健康状态,并告警提醒,就是自定义了health。
要自定义health,可以自定义 HealthIndicator 来添加自定义的健康检查项。HealthIndicator 接口定义了一个 health() 方法,该方法返回一个 Health 对象,其中包含了应用程序的健康信息。也可以通过继承AbstractHealthIndicator抽象类来实现。
import org.springframework.boot.actuate.health.Health;
import org.springframework.boot.actuate.health.HealthIndicator;
import org.springframework.stereotype.Component;@Component
public class CustomHealthIndicator implements HealthIndicator {@Overridepublic Health health() {// 实现自定义的健康检查逻辑boolean isHealthy = checkHealth(); // 替换为实际的健康检查逻辑if (isHealthy) {return Health.up().withDetail("message", "Application is healthy").build();} else {return Health.down().withDetail("message", "Application is not healthy").build();}}private boolean checkHealth() {// 实际的健康检查逻辑,例如检查数据库连接、第三方服务状态等// 返回 true 表示健康,返回 false 表示不健康// 这里简单返回 true,实际应用中需要根据业务逻辑进行判断return true;}
}
运行程序,访问http://localhost:8081/actuator/health:
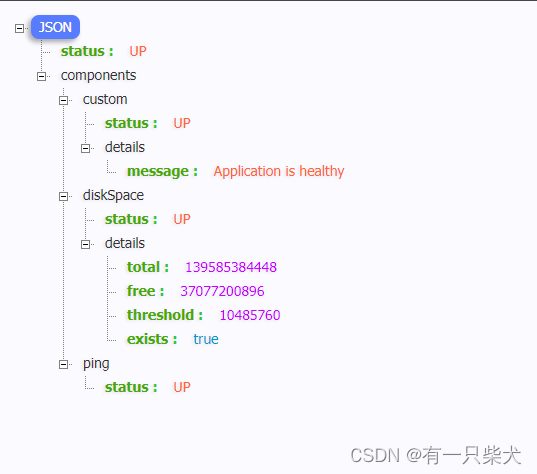
此外,可以添加以下配置,来查看health的详细信息:
management:endpoint:health:show-details: always6、附录
贴出之前我对第三方API地址进行拨测的,实现health方式来检测健康状态的部分关键代码:
ThirdPartApiManager.java
import com.google.common.collect.HashBasedTable;
import com.google.common.collect.Table;
import org.springframework.beans.factory.annotation.Autowired;
import org.springframework.context.annotation.Configuration;/*** 第三方api地址管理器,统一管理API地址,不要直接在业务代码写死* 这里管理的api地址会进行状态监控*/
@Configuration
public class ThirdPartApiManager {@AutowiredThirdPartApiIpConfig thirdPartApiIpConfig;public static final Table<String, String, Long> THIRD_PART_API_TABLE = HashBasedTable.create();/*** 每次api心跳间隔,默认10分钟*/public static final Long INTERVAL_MICO_SECONDS = 10 * 60L * 1000;@SuppressWarnings("java:S125")public void thirdPartApiAdd() {//THIRD_PART_API_TABLE.put("获取客户信息", "http://localhost:8080/xxxxx",  1 * 60L * 1000);}}
ThirdPartApiManagerMonitor.java:
import cn.hutool.core.date.DateUtil;
import cn.hutool.json.JSONUtil;
import lombok.extern.slf4j.Slf4j;
import org.springframework.beans.factory.annotation.Autowired;
import org.springframework.boot.actuate.autoconfigure.health.HealthEndpointProperties;
import org.springframework.boot.actuate.autoconfigure.health.HealthIndicatorAutoConfiguration;
import org.springframework.boot.actuate.health.Health;
import org.springframework.boot.actuate.health.HealthIndicator;
import org.springframework.boot.autoconfigure.AutoConfigureBefore;
import org.springframework.boot.context.properties.EnableConfigurationProperties;
import org.springframework.context.ConfigurableApplicationContext;
import org.springframework.context.annotation.Bean;
import org.springframework.context.annotation.Configuration;
import org.springframework.context.annotation.Profile;
import org.springframework.scheduling.annotation.SchedulingConfigurer;
import org.springframework.scheduling.config.ScheduledTaskRegistrar;
import org.springframework.stereotype.Component;import javax.annotation.PostConstruct;
import java.io.IOException;
import java.net.HttpURLConnection;
import java.net.URL;
import java.util.Map;
import java.util.Optional;
import java.util.concurrent.ConcurrentHashMap;
import java.util.function.Function;/*** 第三方api地址心跳拨测* 拨测方式:对http发起options预请求,来诊断该接口的可用性* 注意:这里不发送trace方法,原因是trace可能会被黑客攻击,所以大多数系统trace是关闭的。*/
@Component
@Configuration
@AutoConfigureBefore({HealthIndicatorAutoConfiguration.class})
@EnableConfigurationProperties(HealthEndpointProperties.class)
@Slf4j
@Profile({"prod"})
public class ThirdPartApiManagerMonitor implements SchedulingConfigurer {@AutowiredConfigurableApplicationContext context;@AutowiredThirdPartApiManager thirdPartApiManager;@Beanpublic Map<String, Health> apiHealthResultMap() {return new ConcurrentHashMap<>(ThirdPartApiManager.THIRD_PART_API_TABLE.columnKeySet().size());}Function<ThirdPartApiDto, Health> healthIndicatorFunction = apiDto -> {Health.Builder healthBuilder = new Health.Builder().status(String.valueOf(apiDto.getStatus())).withDetail("httpCode", apiDto.getStatus()).withDetail("name", apiDto.getName()).withDetail("url", apiDto.getApi()).withDetail("description", apiDto.getName());/*** 状态码说明:* 100-199 用于指定客户端应相应的某些动作。* 200-299 用于表示请求成功。* 300-399 用于已经移动的文件并且常被包含在定位头信息中指定新的地址信息。* 400-499 用于指出客户端的错误。* 500-599 用于支持服务器错误。*/if (apiDto.getStatus() >= 400) {// 推送提醒......sendLarkMessage(apiDto);return healthBuilder.down().build();}return healthBuilder.up().build();};public int tryConnect(String url) {try {URL urlObj = new URL(url);HttpURLConnection connect = (HttpURLConnection) urlObj.openConnection();connect.setUseCaches(false);connect.setRequestMethod("OPTIONS");connect.setConnectTimeout(5000);return connect.getResponseCode();} catch (IOException e) {// nopreturn 500;}}@PostConstructpublic void registerApiHealth() {thirdPartApiManager.thirdPartApiAdd();ThirdPartApiManager.THIRD_PART_API_TABLE.columnKeySet().forEach(api -> {Optional<String> first = ThirdPartApiManager.THIRD_PART_API_TABLE.column(api).keySet().stream().findFirst();if (!first.isPresent()) {return;}context.getBeanFactory().registerSingleton(first.get() + "HealthIndicator", (HealthIndicator) () -> {if (apiHealthResultMap().containsKey(first.get())) {return apiHealthResultMap().get(first.get());}int status = tryConnect(api);ThirdPartApiDto thirdPartApiDto = ThirdPartApiDto.builder().name(first.get()).api(api).interval(ThirdPartApiManager.THIRD_PART_API_TABLE.column(api).getOrDefault(first.get(), ThirdPartApiManager.INTERVAL_MICO_SECONDS)).status(status).result(JSONUtil.toJsonStr(status)).createTime(DateUtil.now()).build();return healthIndicatorFunction.apply(thirdPartApiDto);});});}/*** 按照配置api,定时监控外部http状态*/@Overridepublic void configureTasks(ScheduledTaskRegistrar scheduledTaskRegistrar) {ThirdPartApiManager.THIRD_PART_API_TABLE.columnKeySet().forEach(api -> {Optional<String> first = ThirdPartApiManager.THIRD_PART_API_TABLE.column(api).keySet().stream().findFirst();if (!first.isPresent()) {return;}LOGGER.info("拨测接口:{}, 地址:{}", first.get(), api);scheduledTaskRegistrar.addFixedRateTask(() -> {int status = tryConnect(api);ThirdPartApiDto thirdPartApiDto = ThirdPartApiDto.builder().name(first.get()).api(api).interval(ThirdPartApiManager.THIRD_PART_API_TABLE.column(api).getOrDefault(first.get(), ThirdPartApiManager.INTERVAL_MICO_SECONDS)).status(status).result(JSONUtil.toJsonStr(status)).createTime(DateUtil.now()).build();apiHealthResultMap().put(first.get(), healthIndicatorFunction.apply(thirdPartApiDto));}, ThirdPartApiManager.THIRD_PART_API_TABLE.column(api).getOrDefault(first.get(), ThirdPartApiManager.INTERVAL_MICO_SECONDS));});}@Beanpublic HealthIndicator testHealthIndicator() {return () -> new Health.Builder().up().build();}public void sendLarkMessage(ThirdPartApiDto thirdPartApiDto) {// ...}
}
7、小结
Spring Actuator在实际项目中使用还是很广泛的,根据项目实际情况适当扩展或自定义各个端点,提供更契合场景的度量指标,对项目会有很大的帮助。