FORCE learning
参考文献
-
Generating Coherent Patterns of Activity from Chaotic Neural Networks

-
Collective dynamics of rate neurons for supervised learning in a reservoir computing system

工作原理
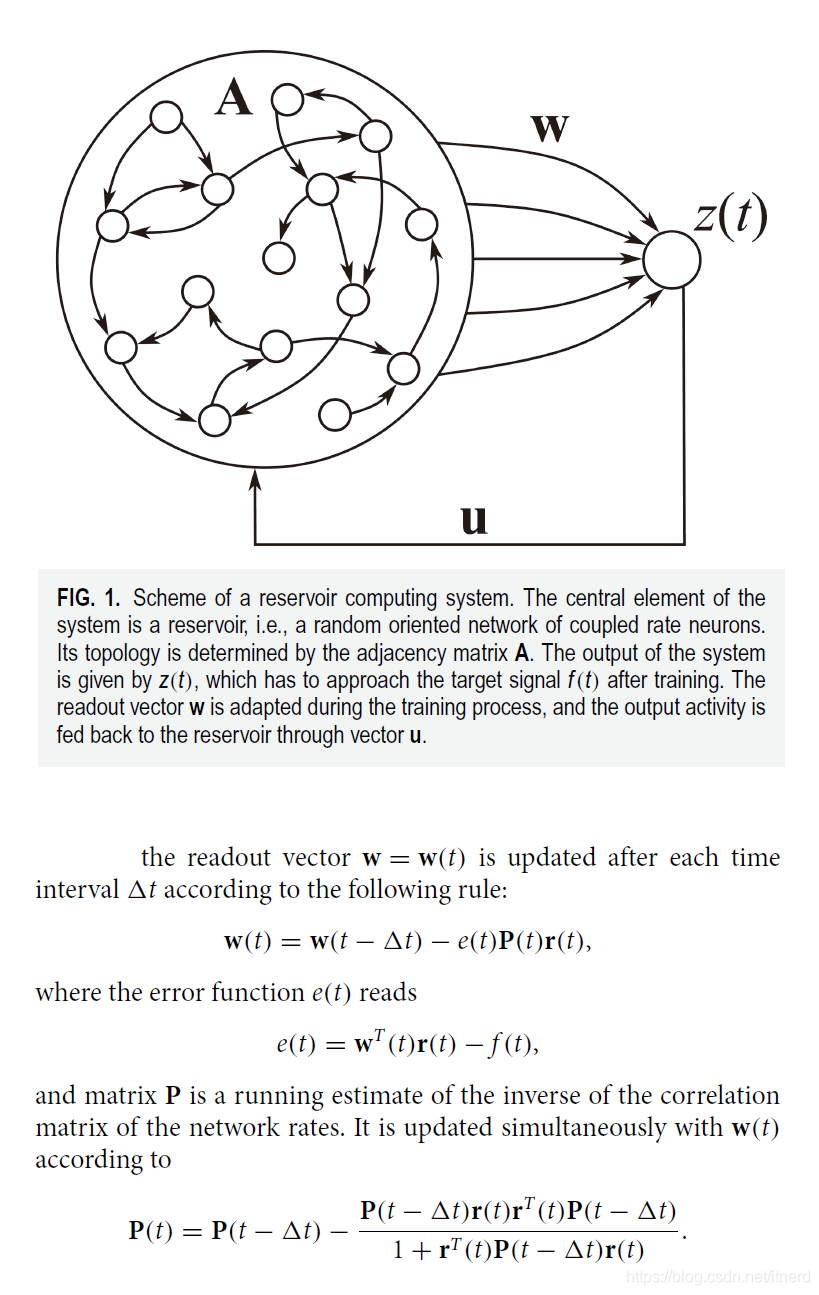
将递归最小二乘法(RLS)用于储备池的输出权重在线更新
import numpy as np
import random
import os
import time
import pandas as pd
import matplotlib.pyplot as plt
%matplotlib qt5
from tqdm.notebook import tqdm

def set_seed(seed=None):
    pass

system_name = 'lorentz'
Y = np.loadtxt('dataset/'+system_name+'.txt', delimiter=',').T
T = Y.shape[1]

inSize = Y.shape[0]
outSize = inSize
resSize = 400
a = 0.9
K = 1
reg = 1e-6
input_scaling = 0.5

train_time = 1000
seed = 44
set_seed(seed)
Win = (np.random.rand(resSize,1+inSize)-0.5) * input_scaling
W = np.random.rand(resSize,resSize)-0.5
rhoW = np.sqrt(max(abs(np.linalg.eig(W@W.T)[0]))) # maximal eigenvalue
W = W/rhoW*(K-1+a)/a
Wout = np.random.rand(outSize, 1+inSize+resSize) - 0.5


x = np.zeros((resSize,1))
S = np.zeros((1+inSize+resSize,T))
Z = np.zeros([outSize, T])
Error = np.zeros([inSize, T])
Time = list(range(T))
P = np.eye(S.shape[0])/reg

f, ax =plt.subplots(nrows=1,ncols=2, figsize=(20,5))
ax[0].set_xlabel('Time')
ax[0].set_ylabel('f(t)')
line1, line2, line3 = None, None, None
plt.grid(True)
plt.ion()

for t in tqdm(range(1,T)):
    if t < train_time:
        u = Y[:,t-1:t] + np.random.randn(inSize,1)*0.001
    else:
        u = z
    x = (1-a) * x + a * np.tanh(Win @ np.vstack((1, u))) + W @ x)
    s =  np.vstack((1,u,x))
    z = Wout @ s
    y = Y[:,t:t+1]
    dy = z - y
    P -= P @ s @ s.T @ P/(1+s.T @ P @ s)
    dWout = dy @ (P @ s).T

    if t < train_time:
        Wout -= dWout

    S[:,t:t+1] = s
    Z[:,t:t+1] = z
    Error[:,t:t+1] = np.abs(dy)

    """
    画图
	"""
    if line1 is None:
        line1 = ax[0].plot(Time[1:t],Z[0,1:t],'-g',marker='*', label='output')[0]
        line2 = ax[0].plot(Time[1:t],Y[0,1:t],'-r',marker='*', label='target')[0]
        line3 = ax[1].plot(Time[1:t],Error[0,1:t],'-k',marker='.', label='error')[0]
        ax[0].legend(loc='upper left')
        ax[1].legend(loc='upper left')

    line1.set_xdata(Time[1:t])
    line1.set_ydata(Z[0,1:t])
    line3.set_xdata(Time[1:t])
    line3.set_ydata(Error[0,1:t])
    line2.set_xdata(Time[1:t])
    line2.set_ydata(Y[0,1:t])

    ax[0].set_xlim([t-300,t+1])
    ax[0].set_ylim([0,1])
    ax[1].set_xlim([t-300,t+1])
    ax[1].set_yscale("log")
    ax[1].set_ylim([1e-6,10])
    plt.pause(0.001)
- 训练阶段:
t
<
train_time
=
1000
t < \text{train\_time} = 1000
t<train_time=1000
- 训练结束后运行, t > train_time = 1000 t > \text{train\_time} = 1000 t>train_time=1000