时间序列特征提取 —— 获取日期相关的协变量
在做时间序列预测时,日期是很重要的特征。
很多由人类活动产生的时间序列都是以日为周期,受到周末、节假日、季度等因素的影响。
下面这段代码就给出一段时间内直接从时间中提取出的七种特征:
- MOH : minute_of_hour
- HOD : hour_of_day
- DOM : day_of_month
- DOW : day_of_week
- DOY : day_of_year
- MOY : month_of_year
- WOY : week_of_year
可以自定义 起始时刻 start_date、采样频率 freq、序列长度 num_ts、是否归一化到
[
−
0.5
,
0.5
]
[-0.5, 0.5]
[−0.5,0.5]
import pandas as pd
import numpy as np
import datetime


class TimeCovariates(object):
    def __init__(self, start_date, num_ts=100, freq="H", normalized=True):
        self.start_date = start_date
        self.num_ts = num_ts
        self.freq = freq
        self.normalized = normalized
        self.dti = pd.date_range(self.start_date, periods=self.num_ts, freq=self.freq)
        self.var_names =  ['MOH', 'HOD', 'DOM', 'DOW', 'DOY', 'MOY', 'WOY']

    def _minute_of_hour(self):
        minutes = np.array(self.dti.minute, dtype=np.float)
        if self.normalized:
            minutes = minutes / 59.0 - 0.5
        return minutes

    def _hour_of_day(self):
        hours = np.array(self.dti.hour, dtype=np.float)
        if self.normalized:
            hours = hours / 23.0 - 0.5
        return hours

    def _day_of_week(self):
        dayWeek = np.array(self.dti.dayofweek, dtype=np.float)
        if self.normalized:
            dayWeek = dayWeek / 6.0 - 0.5
        return dayWeek

    def _day_of_month(self):
        dayMonth = np.array(self.dti.day, dtype=np.float)
        if self.normalized:
            dayMonth = dayMonth / 30.0 - 0.5
        return dayMonth

    def _day_of_year(self):
        dayYear = np.array(self.dti.dayofyear, dtype=np.float)
        if self.normalized:
            dayYear = dayYear / 364.0 - 0.5
        return dayYear

    def _month_of_year(self):
        monthYear = np.array(self.dti.month, dtype=np.float)
        if self.normalized:
            monthYear = monthYear / 11.0 - 0.5
        return monthYear

    def _week_of_year(self):
        weekYear = np.array(self.dti.weekofyear, dtype=np.float)
        if self.normalized:
            weekYear = weekYear / 51.0 - 0.5
        return weekYear

    def get_covariates(self):
        MOH = self._minute_of_hour().reshape(1, -1)
        HOD = self._hour_of_day().reshape(1, -1)
        DOM = self._day_of_month().reshape(1, -1)
        DOW = self._day_of_week().reshape(1, -1)
        DOY = self._day_of_year().reshape(1, -1)
        MOY = self._month_of_year().reshape(1, -1)
        WOY = self._week_of_year().reshape(1, -1)

        all_covs = [MOH, HOD, DOM, DOW, DOY, MOY, WOY]

        return np.vstack(all_covs)
测试
tc = TimeCovariates(datetime.datetime(2020, 5, 20), num_ts=100, freq="D", normalized=True)
vars = tc.get_covariates()
print(vars.shape)
(7, 100)
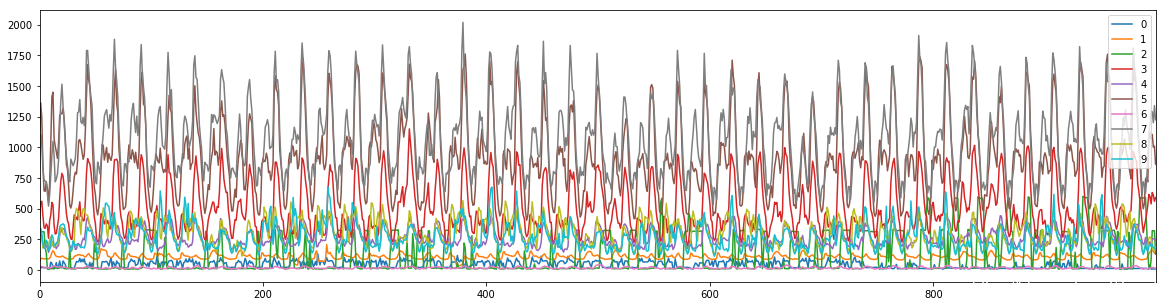
import matplotlib.pyplot as plt
plt.plot(vars.T, alpha=0.8)
plt.legend(labels=tc.var_names)
plt.show()
