微信朋友圈数据挖掘
登录微信
import itchat
# 二维码登陆
itchat.auto_login()
'''
Getting uuid of QR code.
Downloading QR code.
Please scan the QR code to log in.
Please press confirm on your phone.
Loading the contact, this may take a little while.
Login successfully as xxxxxx
'''
获取好友信息
friends = itchat.get_friends(update=True)
属性列表
keys = friends[0].keys()
print(keys)
'''
dict_keys(['MemberList', 'UserName', 'City', 'DisplayName', 'PYQuanPin', 'RemarkPYInitial', 'Province', 'KeyWord', 'RemarkName', 'PYInitial', 'EncryChatRoomId', 'Alias', 'Signature', 'NickName', 'RemarkPYQuanPin', 'HeadImgUrl', 'UniFriend', 'Sex', 'AppAccountFlag', 'VerifyFlag', 'ChatRoomId', 'HideInputBarFlag', 'AttrStatus', 'SnsFlag', 'MemberCount', 'OwnerUin', 'ContactFlag', 'Uin', 'StarFriend', 'Statues', 'WebWxPluginSwitch', 'HeadImgFlag', 'IsOwner'])
'''
用 pandas 处理朋友信息
import pandas as pd
num_friends = len(friends[:])
raw = { key:[friends[i].get(key) for i in range(num_friends)] for key in keys }
# 转化成 pandas 的 dataframe 格式
data = pd.DataFrame(raw)
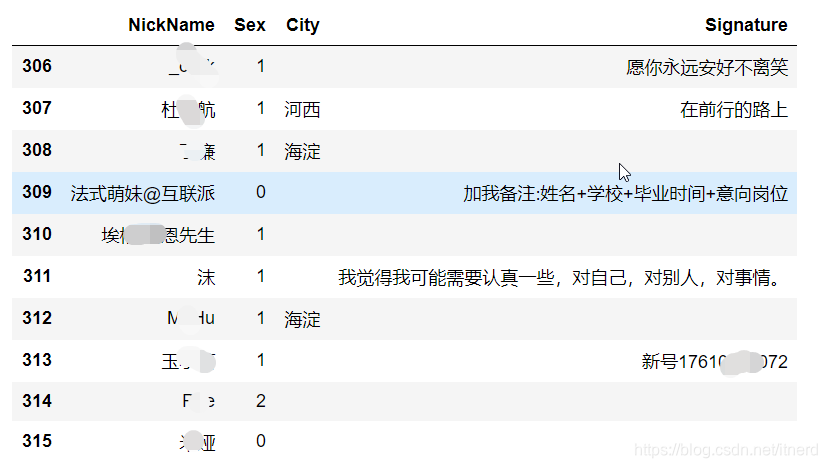
cat = ['NickName','Sex','City','Signature']
data[cat].tail(10)
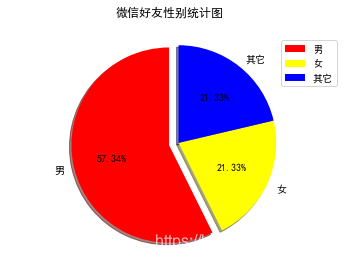
统计朋友性别比例
import numpy as np
import matplotlib.pyplot as plt
%matplotlib inline
plt.rcParams['font.sans-serif']=['SimHei']

num_male = np.sum(1==data['Sex'])
num_female = np.sum(2==data['Sex'])
num_other = np.sum(0==data['Sex'])

size=[num_male, num_female, num_other]
colors = ['red', 'yellow', 'blue']
labels=["男","女", "其它"]
explode = (0.1,0,0)

plt.pie(size,
        explode=explode,
        labels=labels,
        colors=colors,
        autopct='%.2f%%',
        shadow=True,
        startangle=90)

plt.axis('equal')
plt.legend()
plt.suptitle("微信好友性别统计图")
plt.show()
好友地理分布
province = data['Province']
province_distribution = {}
for item in province:
    if re.search('[a-zA]',item) or len(item)==0:  # 删除英文地名以及空值
        continue
    elif not province_distribution.__contains__(item):
        province_distribution[item] = 1
    else:
        province_distribution[item] += 1

print(province_distribution)
'''
{'吉林': 3, '江西': 17, '北京': 110, '上海': 7, '浙江': 7, '广东': 16, '河北': 2, '重庆': 1, '安徽': 1, '湖北': 5, '江苏': 7, '天津': 3, '四川': 6, '山西': 1, '辽宁': 1, '黑龙江': 1, '陕西': 4, '河南': 3, '山东': 3, '湖南': 3, '内蒙古': 1, '宁夏': 1, '云南': 1}
'''
使用 pyecharts 可视化
from pyecharts.charts import Map
map = Map()
map.add("", [(k,v) for k,v in zip(province_distribution.keys(), province_distribution.values())])
map.set_global_opts(
          title_opts = opts.TitleOpts(title="好友分布"),
          visualmap_opts = opts.VisualMapOpts(max_=200))

map.render(path="好友分布.html")
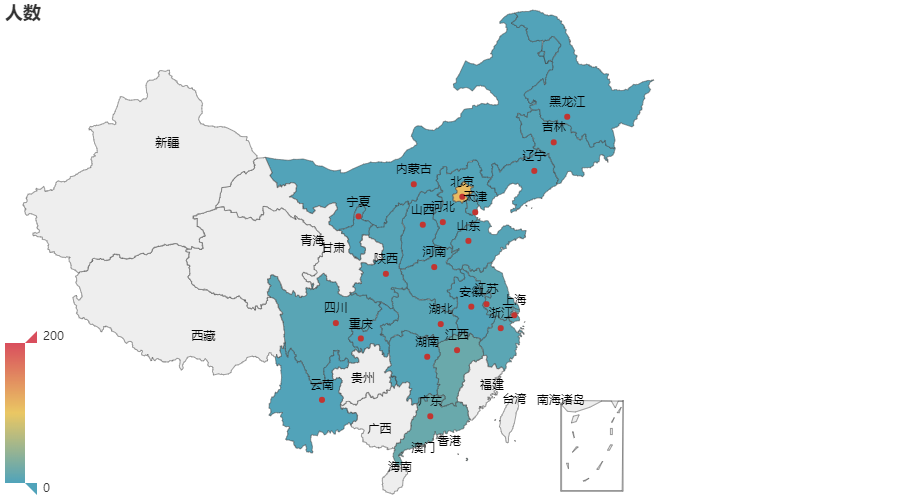
Echarts 是一个由百度开源的数据可视化,凭借着良好的交互性,精巧的图表设计,得到了众多开发者的认可。而 Python 是一门富有表达力的语言,很适合用于数据处理。当数据分析遇上数据可视化时,pyecharts 诞生了。
制作朋友个性签名的词云
import re
import jieba
from wordcloud import WordCloud,ImageColorGenerator

# 搜集朋友的个性签名,滤掉非常规字符
sigs = []
for f in friends:
    Signature = f['Signature'].strip().replace('span','').replace('class','').replace('emoji','')
    Signature = re.compile('1f\d+\w*|[<>/=]').sub('',Signature)
    sigs.append(Signature)

# 使用 jieba 分词
text = ' '.join(sigs)
wordlist = jieba.cut(text,cut_all=False)
word_space_split = ' '.join(wordlist)

# 生成词云
WC = WordCloud(background_color='white',
               max_words=2000,
               max_font_size=100,
               font_path="C:/Windows/Fonts//STFANGSO.ttf", # 设置字体类型,防止中文乱码
               random_state=42,
               scale = 8)  # 设置生成图片的清晰度
WC.generate(word_space_split)

plt.figure(figsize=(20,15))
plt.imshow(WC)
plt.axis("off")
plt.show()