pandas 学习
读取 csv
import pandas as pd
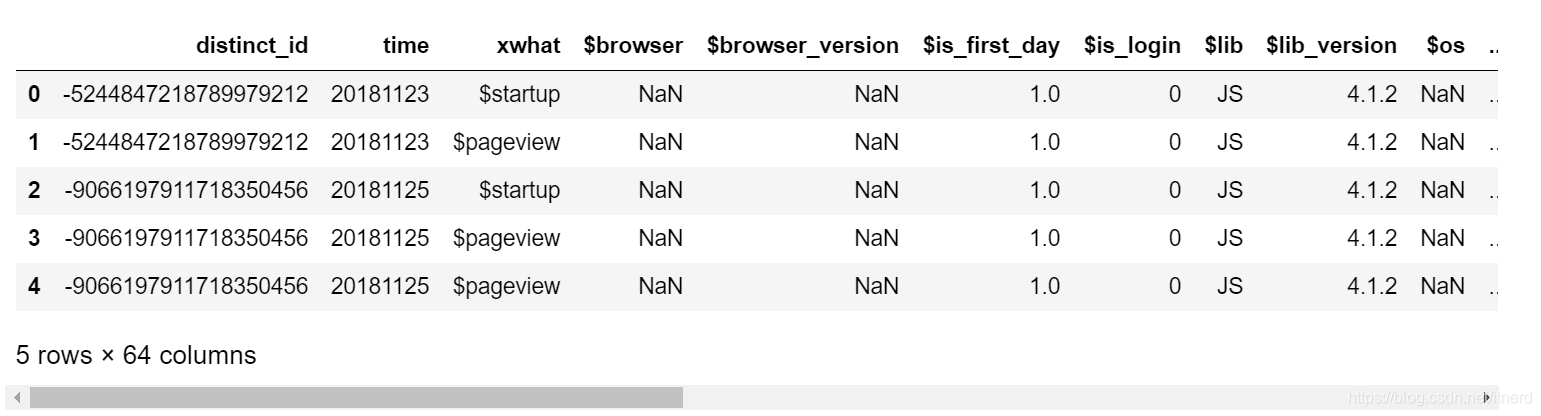
df = pd.read_csv('event_detail.csv',nrows=1000)
df.head()
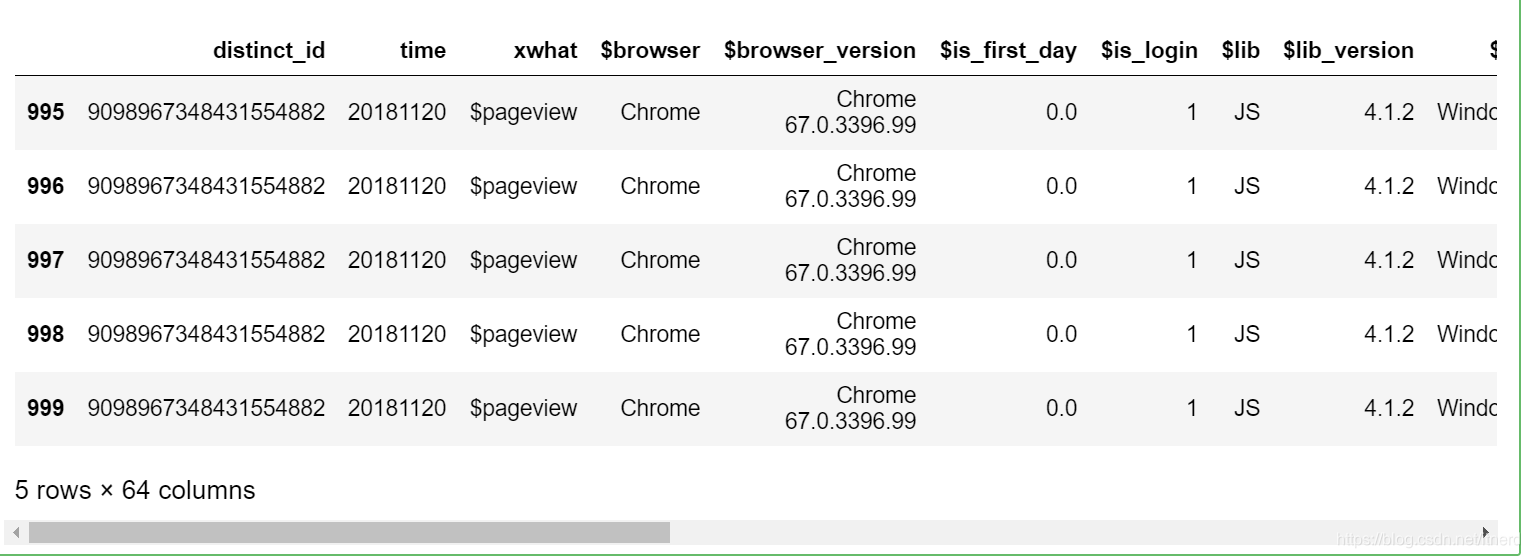
df.tail()
获取列名
list(df)
['distinct_id',
 'time',
 'xwhat',
 '$browser',
 '$browser_version',
 '$is_first_day',
 '$is_login',
 '$lib',
 '$lib_version',
 '$os',
 '$os_version',
 ...
 '$signup_time',
 '$url_domain',
 '$is_time_calibrated',
 '$click_x',
 '$click_y',
 '$device_type',
 '$element_path',
 '$page_height',
 '$page_width',
 '$event_duration',
 '$viewport_height',
 '$viewport_position',
 '$viewport_width',
 '$campaign_shortlink',
 '$pagename',
 'nav_name',
 'referrer_demo',
 'board_name',
 'click_position',
 'datafrom']
将数据转化成 array
df.get_values()
array([[-5244847218789979212, 20181123, '$startup', ..., nan, nan, nan],
       [-5244847218789979212, 20181123, '$pageview', ..., nan, nan, nan],
       [-9066197911718350456, 20181125, '$startup', ..., nan, nan, nan],
       ...,
       [9098967348431554882, 20181120, '$pageview', ..., nan, nan, nan],
       [9098967348431554882, 20181120, '$pageview', ..., nan, nan, nan],
       [9098967348431554882, 20181120, '$pageview', ..., nan, nan, nan]],
      dtype=object)
查看每一列中缺失数据有多少
import numpy as np
import matplotlib.pyplot as plt
plt.figure(figsize=(20,5))
count = df.isnull().sum()/1000 # 1000行数据
count.plot( kind='bar', alpha= 0.7)
plt.show()
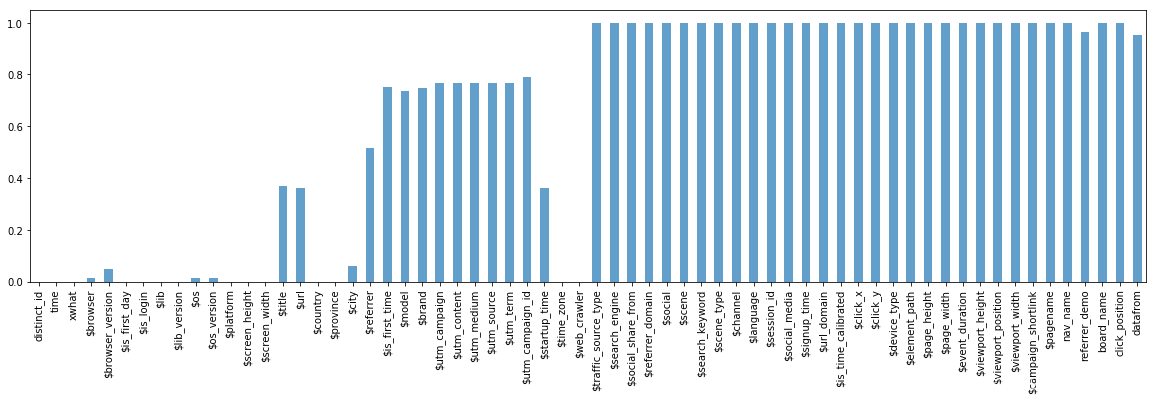
上面那写全是 NULL 的列可以直接抛弃了
selected_keys = list(count[count<=0.01].keys())
df[selected_keys]
	distinct_id	time	xwhat	$is_first_day	$is_login	$lib	$lib_version	$platform	$screen_height	$screen_width	$country	$province	$time_zone	$web_crawler
0	-5244847218789979212	20181123	$startup	1.0	0	JS	4.1.2	JS	1024.0	1024.0	中国	北京	GMT-08:00	1.0
1	-5244847218789979212	20181123	$pageview	1.0	0	JS	4.1.2	JS	1024.0	1024.0	中国	北京	GMT-08:00	1.0
2	-9066197911718350456	20181125	$startup	1.0	0	JS	4.1.2	JS	1600.0	1600.0	中国	北京	GMT+08:00	1.0
3	-9066197911718350456	20181125	$pageview	1.0	0	JS	4.1.2	JS	1600.0	1600.0	中国	北京	GMT+08:00	1.0
4	-9066197911718350456	20181125	$pageview	1.0	0	JS	4.1.2	JS	1600.0	1600.0	中国	北京	GMT+08:00	1.0
...	...	...	...	...	...	...	...	...	...	...	...	...	...	...

998	9098967348431554882		20181120	$pageview	0.0	1	JS	4.1.2	JS	1080.0	1920.0	中国	湖南	GMT+08:00	0.0
999	9098967348431554882		20181120	$pageview	0.0	1	JS	4.1.2	JS	1080.0	1920.0	中国	湖南	GMT+08:00	0.0
1000 rows × 14 columns
透视表
selected = df[selected_keys]
selected['time'].astype(np.dtype('datetime64[ns]'))
total_actions = selected.pivot_table('distinct_id', index='time', columns='xwhat', aggfunc='count',fill_value=0, margins=True)
total_actions
xwhat	$pageview	$startup	ClickMPA	ClickNav	Signup	chart_area_panel	company_size_sel	corporate_name_click	demo_click	department_sel	...	login	reg_agree_click	reg_code_input	reg_getmsg_click	reg_input_success	reg_mail_input	reg_msg_input	reg_phone_input	reg_submit_click	All
time
20181120	271	82	0	0	0	0	2	2	14	2	...	2	3	1	1	2	1	2	1	5	406
20181123	1	1	0	0	0	0	0	0	0	0	...	0	0	0	0	0	0	0	0	0	2
20181124	30	30	0	0	0	0	0	0	0	0	...	0	0	0	0	0	0	0	0	0	60
20181125	337	134	3	1	2	3	0	0	4	0	...	0	2	6	2	2	2	2	4	3	530
20181228	1	1	0	0	0	0	0	0	0	0	...	0	0	0	0	0	0	0	0	0	2
All			640	248	3	1	2	3	2	2	18	2	...	2	5	7	3	4	3	4	5	8	1000
6 rows × 22 columns
total_actions[['$pageview','reg_input_success']].plot(subplots=False, figsize=(18,6), kind='area')
plt.show()