Windows高级调试(学习笔记)-第二章-调试器介绍
Chapter 2 Introduction to Debuggers
2.1 调试器基础知识
2.1.1 Debugger Types调试器类型
- User Mode Deduggers(用户态调试器)
实时调试(Living Debugging)、事后调试(Postmortem Debugging)
三个用户态调试器:cdb.exe、nstd.exe及windbg.exe - Kernel Mode Debugger(内核态调试器)
可以分析计算机系统
二个内核态调试器:kd.exe及windbg.exe
2.1.2 Debugger Commands调试器命令
built-in command 内置命令:kP
meta-command 元命令: .help
extension command 扩展命令:!thread (格式:!module.extension [arguments])
2.1.3 Setting up the Debuggers调试器配置
- 用户态调试器
被调试的目标映像以及与映像相关的符号信息 - 内核态调试器
2.2 Basic Debugger Tasks基本调试任务
2.2.1 Entering Debugger Commands输入调试命令
2.2.2 Interpreting the Debugger Prompt解析调试器提示信息
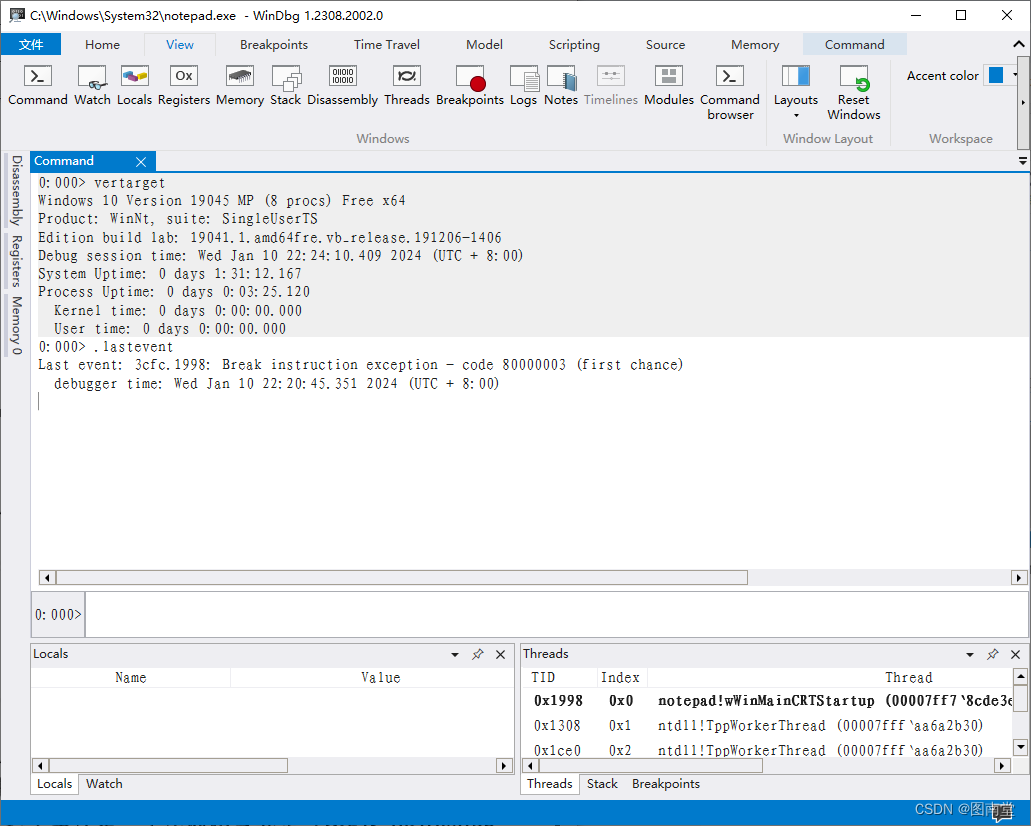
vertarget (Show Target Computer Version,显示目标计算机版本)
.lastevent (Display Last Event,显示最后一个事件)
3cfc.1998 (十六进制),其中3cfc为进程ID,1998为线程ID
0:000> 0表示用户(同时调试多个进程时,分别0、1…),000为线程编号
2.2.3 Setting Up and Using the Symbols配置和使用符号
符号文件格式:COFF(Common Object File Format)
CV(CodeView format)
PDB(Program Database format)
符号文件包含的内容:
- 全局变量的名字和地址
- 函数名、地址及其原型
- 帧指针代码(Frame Pointer Optimization,FPO)数据
- 局部变量的名字和地址
- 源文件路径以及每个符号的行号
- 变量、结构等的类型信息
2.2.4 Symbol Path符号路径
符号路径可以为:本地路径、UNC共享连接或符号服务器,多个用“;”分号隔开
命令:
.sympath[+] [path1[;path2[;…]]] Set Symbol Path设置符号路径
追加(+)或替换符号路径,多个用";"隔开
从https://msdl.microsoft.com/download/symbols下载的符号缓存到本地I:\Symbols目录下
.sympath cache*I:\Symbols;srv*https://msdl.microsoft.com/download/symbols
.sympath srv*I:\Symbols*https://msdl.microsoft.com/download/symbols
.sympath //显示设置的符号路径
使用agestore维护过期缓存
列2023-11-01之后没有访问过的文件(不加-l的话,直接删除,谨慎使用)
I:\Symbols\>agestore.exe -date=11-01-23 -l -s I:\Symbols
2.2.5 Setting the Symbol Path设置符号路径
系统变量 _NT_ALT_SYMBOL_PATH 和 _NT_SYMBOL_PATH
可通过在程序启动时,通过
C:\>windbg -y 符号路径 调试程序.exe
.symfix[+] [LocalSymbolCache]
.symfix I:\Symbols 相同于 .sympath cacheI:\Symbols;SRVhttps://msdl.microsoft.com/download/symbols
2.2.6 Checking the Loaded Modules and Symbol Files检查已加载的模块和符号
lm 列出已加载模块
lm options [a Address] [m pattern | M Pattern](List Loaded Modules,列出已加载模块) 详细介绍
0:000> lm
start             end                 module name
00007ff6`c5920000 00007ff6`c5947000   02Sample C (private pdb symbols)  H:\Books\AdvWinDebug\AdvancedWindowsDebugging\awd\x64\Debug\02Sample.pdb
00007ffa`74f80000 00007ffa`75061000   MSVCP140D   (deferred)
00007ffa`75070000 00007ffa`75291000   ucrtbased   (deferred)
00007ffa`77370000 00007ffa`7739e000   VCRUNTIME140D   (deferred)
00007ffb`073b0000 00007ffb`073bf000   VCRUNTIME140_1D   (deferred)
00007ffb`3b340000 00007ffb`3b3d0000   apphelp    (deferred)
00007ffb`3ec50000 00007ffb`3ef46000   KERNELBASE   (deferred)
00007ffb`3f340000 00007ffb`3f3fd000   KERNEL32   (deferred)
00007ffb`412b0000 00007ffb`414a8000   ntdll      (pdb symbols)          i:\symbols\ntdll.pdb\A372A05ADCAA11CA41FD4A931AB93BB31\ntdll.pdb
lm l 列有符号的模块
0:000> lm l
start             end                 module name
00007ff6`c5920000 00007ff6`c5947000   02Sample C (private pdb symbols)  H:\Books\AdvWinDebug\AdvancedWindowsDebugging\awd\x64\Debug\02Sample.pdb
00007ffb`412b0000 00007ffb`414a8000   ntdll      (pdb symbols)          i:\symbols\ntdll.pdb\A372A05ADCAA11CA41FD4A931AB93BB31\ntdll.pdb
lm f 列出模块路径
0:000> lm f
start             end                 module name
00007ff6`c5920000 00007ff6`c5947000   02Sample 02Sample.exe
00007ffa`74f80000 00007ffa`75061000   MSVCP140D C:\WINDOWS\SYSTEM32\MSVCP140D.dll
00007ffa`75070000 00007ffa`75291000   ucrtbased C:\WINDOWS\SYSTEM32\ucrtbased.dll
00007ffa`77370000 00007ffa`7739e000   VCRUNTIME140D C:\WINDOWS\SYSTEM32\VCRUNTIME140D.dll
00007ffb`073b0000 00007ffb`073bf000   VCRUNTIME140_1D C:\WINDOWS\SYSTEM32\VCRUNTIME140_1D.dll
00007ffb`3b340000 00007ffb`3b3d0000   apphelp  C:\WINDOWS\SYSTEM32\apphelp.dll
00007ffb`3ec50000 00007ffb`3ef46000   KERNELBASE C:\WINDOWS\System32\KERNELBASE.dll
00007ffb`3f340000 00007ffb`3f3fd000   KERNEL32 C:\WINDOWS\System32\KERNEL32.DLL
00007ffb`412b0000 00007ffb`414a8000   ntdll    ntdll.dll
lm a Address 列出某个地址所在的模块
0:000> lm a 00007ff6`c5930000
Browse full module list
start             end                 module name
00007ff6`c5920000 00007ff6`c5947000   02Sample C (private pdb symbols)  H:\Books\AdvWinDebug\AdvancedWindowsDebugging\awd\x64\Debug\02Sample.pdb
lm m Pattern 列出模块名称匹配的模块
0:000> lm m *samp*
Browse full module list
start             end                 module name
00007ff6`c5920000 00007ff6`c5947000   02Sample C (private pdb symbols)  H:\Books\AdvWinDebug\AdvancedWindowsDebugging\awd\x64\Debug\02Sample.pdb
lm M Partten 列出路径匹配的模块
0:000> lm f M *32*
Browse full module list
start             end                 module name
00007ffa`74f80000 00007ffa`75061000   MSVCP140D C:\WINDOWS\SYSTEM32\MSVCP140D.dll
00007ffa`75070000 00007ffa`75291000   ucrtbased C:\WINDOWS\SYSTEM32\ucrtbased.dll
00007ffa`77370000 00007ffa`7739e000   VCRUNTIME140D C:\WINDOWS\SYSTEM32\VCRUNTIME140D.dll
00007ffb`073b0000 00007ffb`073bf000   VCRUNTIME140_1D C:\WINDOWS\SYSTEM32\VCRUNTIME140_1D.dll
00007ffb`3b340000 00007ffb`3b3d0000   apphelp  C:\WINDOWS\SYSTEM32\apphelp.dll
00007ffb`3ec50000 00007ffb`3ef46000   KERNELBASE C:\WINDOWS\System32\KERNELBASE.dll
00007ffb`3f340000 00007ffb`3f3fd000   KERNEL32 C:\WINDOWS\System32\KERNEL32.DLL
!lmi 显示模块详细内容
!lmi Module 详细介绍
Module:可以为模块名或地址
0:000> !lmi ntdll.dll
Loaded Module Info: [ntdll.dll] Module: ntdllBase Address: 00007ffb412b0000Image Name: ntdll.dllMachine Type: 34404 (X64)Time Stamp: 9b64aa6f (This is a reproducible build file hash, not a true timestamp)Size: 1f8000CheckSum: 1f1c9f
Characteristics: 2022
Debug Data Dirs: Type  Size     VA  PointerCODEVIEW    22, 140130,  13cf30 RSDS - GUID: {A372A05A-DCAA-11CA-41FD-4A931AB93BB3}Age: 1, Pdb: ntdll.pdbPOGO   698, 140154,  13cf54 [Data not mapped]REPRO    24, 1407ec,  13d5ec Reproducible buildDLLCHAR_EX     4, 140810,  13d610 Extended DLL characteristics: 00000001CET compatibleImage Type: FILE     - Image read successfully from debugger.C:\WINDOWS\SYSTEM32\ntdll.dllSymbol Type: PDB      - Symbols loaded successfully from symbol server.i:\symbols\ntdll.pdb\A372A05ADCAA11CA41FD4A931AB93BB31\ntdll.pdbLoad Report: public symbols , not source indexed i:\symbols\ntdll.pdb\A372A05ADCAA11CA41FD4A931AB93BB31\ntdll.pdb
!dh 显示映像头信息
详细介绍
调试堆栈溢出时
0:000> !dh -h
Usage: dh [options] address
Dumps headers from an image based at address
Options:-a      Dump everything-f      Dump file headers-s      Dump section headers-e      Dump exports-i      Dump imports
调试堆栈溢出问题时,可能需要!dh | -f来参数stack reserve size
0:000> !dh ntdll.dll -fFile Type: DLL
FILE HEADER VALUES8664 machine (X64)A number of sections
9B64AA6F time date stamp Mon Aug 12 16:55:11 20520 file pointer to symbol table0 number of symbolsF0 size of optional header2022 characteristicsExecutableApp can handle >2gb addressesDLLOPTIONAL HEADER VALUES20B magic #14.20 linker version119A00 size of codeD6200 size of initialized data0 size of uninitialized data0 address of entry point1000 base of code----- new -----
00007ffb412b0000 image base1000 section alignment200 file alignment3 subsystem (Windows CUI)10.00 operating system version10.00 image version10.00 subsystem version1F8000 size of image400 size of headers1F1C9F checksum
0000000000040000 size of stack reserve
0000000000001000 size of stack commit
0000000000100000 size of heap reserve
0000000000001000 size of heap commit4160  DLL characteristicsHigh entropy VA supportedDynamic baseNX compatibleGuard152180 [   12EE1] address [size] of Export Directory0 [       0] address [size] of Import Directory186000 [   70508] address [size] of Resource Directory172000 [    E4F0] address [size] of Exception Directory1E8A00 [    6C28] address [size] of Security Directory1F7000 [     544] address [size] of Base Relocation Directory126960 [      70] address [size] of Debug Directory0 [       0] address [size] of Description Directory0 [       0] address [size] of Special Directory0 [       0] address [size] of Thread Storage Directory11DB80 [     118] address [size] of Load Configuration Directory0 [       0] address [size] of Bound Import Directory0 [       0] address [size] of Import Address Table Directory0 [       0] address [size] of Delay Import Directory0 [       0] address [size] of COR20 Header Directory0 [       0] address [size] of Reserved Directory
2.2.7 Reloading the Symbols重新加载符号
.reload Reload Module重新加载模块
错误的符号比没有符号更糟糕
0:000> .reload /f ntdll.dll
0:000> !sym noisy
2.2.8 validating Symbols验证符号
!chksym Module [Symbol] 添加链接描述
0:000> !chksym ntdll.dllntdll.dllTimestamp: 9B64AA6FSizeOfImage: 1F8000pdb: ntdll.pdbpdb sig: A372A05A-DCAA-11CA-41FD-4A931AB93BB3age: 1Loaded pdb is i:\symbols\ntdll.pdb\A372A05ADCAA11CA41FD4A931AB93BB31\ntdll.pdbntdll.pdbpdb sig: A372A05A-DCAA-11CA-41FD-4A931AB93BB3age: 3age MISMATCH: ntdll.pdb and ntdll.dll
age MISMATH??
2.2.9 Using Symbols使用符号
x [Options] Module!Symbol
x [Options] *
Examine Symbols检查符号
0:000> x notepad!*winMain*; *搜索notepad中函数名包含winMain的函数
00007ff6`fde1ad5c notepad!wWinMain (wWinMain)
00007ff6`fde36f78 notepad!_imp__get_wide_winmain_command_line = <no type information>
00007ff6`fde33e90 notepad!wWinMainCRTStartup (wWinMainCRTStartup)
00007ff6`fde36f78 notepad!_imp__o__get_wide_winmain_command_line = <no type information>
00007ff6`fde34dc0 notepad!get_wide_winmain_command_line (_get_wide_winmain_command_line)
00007ff6`fde34dc0 notepad!o__get_wide_winmain_command_line (_o__get_wide_winmain_command_line)
0:000> x /v /t notepad!*winMain*
pub func   00007ff6`fde1ad5c    0 <NoType> notepad!wWinMain (wWinMain)
pub global 00007ff6`fde36f78    0 <NoType> notepad!_imp__get_wide_winmain_command_line = <no type information>
pub func   00007ff6`fde33e90    0 <NoType> notepad!wWinMainCRTStartup (wWinMainCRTStartup)
pub global 00007ff6`fde36f78    0 <NoType> notepad!_imp__o__get_wide_winmain_command_line = <no type information>
pub func   00007ff6`fde34dc0    0 <NoType> notepad!get_wide_winmain_command_line (_get_wide_winmain_command_line)
pub func   00007ff6`fde34dc0    0 <NoType> notepad!o__get_wide_winmain_command_line (_o__get_wide_winmain_command_line)
ln [/D] Address List Nearest Symbols列出最近符号/函数
0:000> ln 00007ff6`fde1ad5D
Browse module
Set bu breakpoint(00007ff6`fde1ad5c)   notepad!wWinMain+0x1   |  (00007ff6`fde1b120)   notepad!UpdateStatusBar
00007ff6`fde1ad5D地址离notepad!wWinMain与notepad!UpdateStatusBar函数最近
2.2.10 Using Source Files使用源代码
.srcpath[+] [Directory [; …]]
.lsrcpath[+] [Directory [; …]]
.srcpath, .lsrcpath (Set Source Path设置源码路径)
0:000> .srcpath+ H:\Books\AdvWinDebug\AdvancedWindowsDebugging\02Sample
Source search path is: SRV*;H:\Books\AdvWinDebug\AdvancedWindowsDebugging\01Sample;H:\Books\AdvWinDebug\AdvancedWindowsDebugging\02Sample************* Path validation summary **************
Response                         Time (ms)     Location
Deferred                                       SRV*
OK                                             H:\Books\AdvWinDebug\AdvancedWindowsDebugging\01Sample
OK                                             H:\Books\AdvWinDebug\AdvancedWindowsDebugging\02Sample
.srcnoisy [Options] Noisy Source Loading源码加载详细级别
0:000> .srcnoisy 3
Noisy source output: on
Noisy source server output: on
Filter out everything but source server output: on
.srcfix[+] [Paths]
.lsrcfix[+] [Paths] Use Source Server使用源代码服务器
2.2.11 Exploratory Commands分析命令
Why Did the Debugger Stop?为什么调试会停止?
.lastevent显示最后导致调试停止的信息
0:000>
* after a breakpoint 命中断点
0:000> .lastevent
Last event: 170c.1464: Hit breakpoint 2
0:000>
* after an access violation exception 访问异常
0:000> .lastevent
Last event: 170c.1464: Access violation - code c0000005 (first chance)
What Is the Target System?目标系统是什么
vertarget显示调试目标系统
version显示调试器版本
0:000> vertarget
Windows 10 Version 19045 MP (8 procs) Free x64
Product: WinNt, suite: SingleUserTS
Edition build lab: 19041.1.amd64fre.vb_release.191206-1406
Debug session time: Sat Jan 13 11:28:04.788 2024 (UTC + 8:00)
System Uptime: 0 days 4:05:59.980
Process Uptime: 0 days 0:21:48.951Kernel time: 0 days 0:00:00.015User time: 0 days 0:00:00.000
0:000> version
Windows 10 Version 19045 MP (8 procs) Free x64
Product: WinNt, suite: SingleUserTS
Edition build lab: 19041.1.amd64fre.vb_release.191206-1406
Debug session time: Sat Jan 13 11:28:08.536 2024 (UTC + 8:00)
System Uptime: 0 days 4:06:03.729
Process Uptime: 0 days 0:21:52.699Kernel time: 0 days 0:00:00.015User time: 0 days 0:00:00.000
Live user mode: <Local>Microsoft (R) Windows Debugger Version 10.0.25921.1001 AMD64
Copyright (c) Microsoft Corporation. All rights reserved.command line: '"C:\Program Files\WindowsApps\Microsoft.WinDbg_1.2308.2002.0_x64__8wekyb3d8bbwe\amd64\EngHost.exe" npipe:pipe=DbgX_0403642972494e61961ad9e753d9ac04,password=81289214ae18 "C:\Program Files\WindowsApps\Microsoft.WinDbg_1.2308.2002.0_x64__8wekyb3d8bbwe\amd64" "I:\symbols"'  Debugger Process 0x3614
dbgeng:  image 10.0.25921.1001, [path: C:\Program Files\WindowsApps\Microsoft.WinDbg_1.2308.2002.0_x64__8wekyb3d8bbwe\amd64\dbgeng.dll]
dbghelp: image 10.0.25921.1001, [path: C:\Program Files\WindowsApps\Microsoft.WinDbg_1.2308.2002.0_x64__8wekyb3d8bbwe\amd64\dbghelp.dll]DIA version: 32595
Extension DLL search Path:C:\Program Files\WindowsApps\Microsoft.WinDbg_1.2308.2002.0_x64__8wekyb3d8bbwe\amd64\WINXP;C:\Program Files\WindowsApps\Microsoft.WinDbg_1.2308.2002.0_x64__8wekyb3d8bbwe\amd64\winext;C:\Program Files\WindowsApps\Microsoft.WinDbg_1.2308.2002.0_x64__8wekyb3d8bbwe\amd64\winext\arcade;C:\Program Files\WindowsApps\Microsoft.WinDbg_1.2308.2002.0_x64__8wekyb3d8bbwe\amd64\pri;C:\Program Files\WindowsApps\Microsoft.WinDbg_1.2308.2002.0_x64__8wekyb3d8bbwe\amd64;C:\Users\ryt\AppData\Local\Dbg\EngineExtensions;C:\Program Files\WindowsApps\Microsoft.WinDbg_1.2308.2002.0_x64__8wekyb3d8bbwe\amd64;E:\Program Files (x86)\VMware\VMware Workstation\bin\;E:\Program Files (x86)\Eziriz\.NET Reactor;C:\Program Files (x86)\Common Files\Oracle\Java\javapath;E:\ProgramData\Anaconda3\Scripts\;E:\ProgramData\Anaconda3;C:\Program Files (x86)\Eziriz\.NET Reactor;C:\WINDOWS\System32\Wbem;C:\WINDOWS\System32\WindowsPowerShell\v1.0\;C:\WINDOWS\System32\OpenSSH\;C:\Program Files\Microsoft SQL Server\120\Tools\Binn\;C:\Program Files\Microsoft SQL Server\Client SDK\ODBC\110\Tools\Binn\;C:\Program Files\TortoiseSVN\bin;C:\Program Files\Microsoft SQL Server\130\Tools\Binn\;D:\opencv\build\x64\vc16\bin;C:\Program Files\dotnet\;C:\Program Files\Microsoft SQL Server\Client SDK\ODBC\170\Tools\Binn\;C:\Program Files (x86)\Common Files\Aveva Shared\Plot\;C:\Program Files\Intel\WiFi\bin\;C:\Program Files\Common Files\Intel\WirelessCommon\;C:\Program Files\dotnet\sdk\5.0.100-preview.7.20366.6\;C:\Program Files\Common Files\Autodesk Shared\;C:\ProgramData\chocolatey\bin;C:\WINDOWS\system32;C:\WINDOWS;E:\Program Files\Git\cmd;C:\Program Files (x86)\Microsoft SQL Server\150\DTS\Binn\;C:\Program Files (x86)\Microsoft SQL Server\150\Tools\Binn\;C:\Program Files\Microsoft SQL Server\150\Tools\Binn\;C:\Program Files\Microsoft SQL Server\150\DTS\Binn\;E:\ProgramData\Anaconda3\Library\bin;E:\ProgramData\Anaconda3\Lib;C:\Program Files\NVIDIA Corporation\NVIDIA NvDLISR;E:\ProgramData\Anaconda3;E:\Program Files\CMake\bin;C:\Program Files\Microsoft VS Code\bin;E:\Program Files (x86)\PreEmptive Protection Dotfuscator Professional Evaluation 6.0.1\;C:\Program Files\NVIDIA Corporation\Nsight Compute 2022.3.0\;G:\Android\Appium\jdk-9\BIN;G:\Android\nodeJs;E:\Android\sdk\platform-tools;E:\Android\sdk\tools;C:\Program Files\NVIDIA Corporation\Nsight Compute 2022.1.1\;C:\Program Files (x86)\Windows Kits\10\Windows Performance Toolkit\;C:\Users\ryt\.dnx\bin;C:\Users\ryt\AppData\Local\Microsoft\WindowsApps;C:\Users\ryt\.dotnet\tools;C:\Users\ryt\AppData\Local\Microsoft\WindowsApps;C:\Users\ryt\.dotnet\tools;F:\sqlite3;E:\PyCharm\bin;E:\Program Files\JetBrains\PyCharm 2022.1.3\bin;C:\Users\ryt\.dotnet\tools;E:\Programs\Fiddler;C:\Users\ryt\.dotnet\tools
Extension DLL chain:DbgEngCoreDMExt: image 10.0.25921.1001, API 0.0.0, [path: C:\Program Files\WindowsApps\Microsoft.WinDbg_1.2308.2002.0_x64__8wekyb3d8bbwe\amd64\winext\DbgEngCoreDMExt.dll]dbghelp: image 10.0.25921.1001, API 10.0.6, [path: C:\Program Files\WindowsApps\Microsoft.WinDbg_1.2308.2002.0_x64__8wekyb3d8bbwe\amd64\dbghelp.dll]exts: image 10.0.25921.1001, API 1.0.0, [path: C:\Program Files\WindowsApps\Microsoft.WinDbg_1.2308.2002.0_x64__8wekyb3d8bbwe\amd64\WINXP\exts.dll]uext: image 10.0.25921.1001, API 1.0.0, [path: C:\Program Files\WindowsApps\Microsoft.WinDbg_1.2308.2002.0_x64__8wekyb3d8bbwe\amd64\winext\uext.dll]ntsdexts: image 10.0.25921.1001, API 1.0.0, [path: C:\Program Files\WindowsApps\Microsoft.WinDbg_1.2308.2002.0_x64__8wekyb3d8bbwe\amd64\WINXP\ntsdexts.dll]
What Are the Current Register Values?当前寄存器的值是什么?
[~Thread] r[M Mask|F|X|?] [ Register[:[Num]Type] [= [Value]] ]
r. Register寄存器
0:000> r; *查看当前线程的寄存器
rax=0000000000000000 rbx=00007ffb5cb15a10 rcx=00007ffb5ca8d484
rdx=0000000000000000 rsi=0000000000000010 rdi=000000a7f5be1000
rip=00007ffb5cac0730 rsp=000000a7f5cfee20 rbp=0000000000000000r8=000000a7f5cfee18  r9=0000000000000000 r10=0000000000000000
r11=0000000000000246 r12=0000000000000040 r13=0000000000000000
r14=00007ffb5cb15900 r15=00000258a68a0000
iopl=0         nv up ei pl zr na po nc
cs=0033  ss=002b  ds=002b  es=002b  fs=0053  gs=002b             efl=00000246
ntdll!LdrpDoDebuggerBreak+0x30:
00007ffb`5cac0730 cc              int     3
0:000> ~1 r;*查看1号线程的寄存器
rax=00000000000001d5 rbx=00000258a69c8130 rcx=0000000000000084
rdx=00000258a69c7db0 rsi=00000258a69c5ac0 rdi=00000258a69c8130
rip=00007ffb5ca90a74 rsp=000000a7f5dff8e8 rbp=0000000000000000r8=00000000000005e7  r9=00000000000005e7 r10=00000000000005e7
r11=00000000000005e7 r12=0000000000000000 r13=0000000000000000
r14=0000000000000000 r15=0000000000000000
iopl=0         nv up ei pl zr na po nc
cs=0033  ss=002b  ds=002b  es=002b  fs=0053  gs=002b             efl=00000246
ntdll!NtWaitForWorkViaWorkerFactory+0x14:
00007ffb`5ca90a74 c3              ret
0:000>reax=1; 修改eax=1
0:000> r $ip;*指令指针寄存器
$ip=00007ffb5cac0730
0:000> r $ra;*当前函数的返回地址
$ra=00007ffb5cac3bba
0:000> r $retreg;*主要的值寄存器
$retreg=0000000000000000
0:000> r $csp;*当前的栈指针
$csp=000000a7f5cfee20
0:000> r $proc;*当前的进程
$proc=000000a7f5be1000
0:000> r $thread;*当前的线程
$thread=000000a7f5be2000
0:000> r $tpid;*当前进程的标训(PID)
$tpid=00000000000040c8
0:000> r $tid;*当前线程的标识(TID)
$tid=00000000000017c8
What Code Is the Processor Executing Now?处理器当前执行的代码是什么?
u[u|b] Range
u[u|b] Address
u[u|b]
Unassemble反汇编
从当前$ip开始,反汇编8条指令
0:000> u .
ntdll!LdrpDoDebuggerBreak+0x30:
00007ffb`5cac0730 cc              int     3
00007ffb`5cac0731 eb00            jmp     ntdll!LdrpDoDebuggerBreak+0x33 (00007ffb`5cac0733)
00007ffb`5cac0733 4883c438        add     rsp,38h
00007ffb`5cac0737 c3              ret
00007ffb`5cac0738 cc              int     3
00007ffb`5cac0739 cc              int     3
00007ffb`5cac073a cc              int     3
00007ffb`5cac073b cc              int     3
ub . 向前反汇编8条指令
0:000> ub .
ntdll!LdrpDoDebuggerBreak+0x10:
00007ffb`5cac0710 4c8d442440      lea     r8,[rsp+40h]
00007ffb`5cac0715 418d5110        lea     edx,[r9+10h]
00007ffb`5cac0719 48c7c1feffffff  mov     rcx,0FFFFFFFFFFFFFFFEh
00007ffb`5cac0720 e84bcdfcff      call    ntdll!NtQueryInformationThread (00007ffb`5ca8d470)
00007ffb`5cac0725 85c0            test    eax,eax
00007ffb`5cac0727 780a            js      ntdll!LdrpDoDebuggerBreak+0x33 (00007ffb`5cac0733)
00007ffb`5cac0729 807c244000      cmp     byte ptr [rsp+40h],0
00007ffb`5cac072e 7503            jne     ntdll!LdrpDoDebuggerBreak+0x33 (00007ffb`5cac0733)
0:000> u 00007ffb`5cac0710 00007ffb`5cac0737
ntdll!LdrpDoDebuggerBreak+0x10:
00007ffb`5cac0710 4c8d442440      lea     r8,[rsp+40h]
00007ffb`5cac0715 418d5110        lea     edx,[r9+10h]
00007ffb`5cac0719 48c7c1feffffff  mov     rcx,0FFFFFFFFFFFFFFFEh
00007ffb`5cac0720 e84bcdfcff      call    ntdll!NtQueryInformationThread (00007ffb`5ca8d470)
00007ffb`5cac0725 85c0            test    eax,eax
00007ffb`5cac0727 780a            js      ntdll!LdrpDoDebuggerBreak+0x33 (00007ffb`5cac0733)
00007ffb`5cac0729 807c244000      cmp     byte ptr [rsp+40h],0
00007ffb`5cac072e 7503            jne     ntdll!LdrpDoDebuggerBreak+0x33 (00007ffb`5cac0733)
00007ffb`5cac0730 cc              int     3
00007ffb`5cac0731 eb00            jmp     ntdll!LdrpDoDebuggerBreak+0x33 (00007ffb`5cac0733)
00007ffb`5cac0733 4883c438        add     rsp,38h
00007ffb`5cac0737 c3              ret
uf [Options] Address Unassemble Function反汇编整个函数
0:000> uf .
ntdll!LdrpDoDebuggerBreak:
00007ffb`5cac0700 4883ec38        sub     rsp,38h
00007ffb`5cac0704 488364242000    and     qword ptr [rsp+20h],0
00007ffb`5cac070a 41b901000000    mov     r9d,1
00007ffb`5cac0710 4c8d442440      lea     r8,[rsp+40h]
00007ffb`5cac0715 418d5110        lea     edx,[r9+10h]
00007ffb`5cac0719 48c7c1feffffff  mov     rcx,0FFFFFFFFFFFFFFFEh
00007ffb`5cac0720 e84bcdfcff      call    ntdll!NtQueryInformationThread (00007ffb`5ca8d470)
00007ffb`5cac0725 85c0            test    eax,eax
00007ffb`5cac0727 780a            js      ntdll!LdrpDoDebuggerBreak+0x33 (00007ffb`5cac0733)  Branchntdll!LdrpDoDebuggerBreak+0x29:
00007ffb`5cac0729 807c244000      cmp     byte ptr [rsp+40h],0
00007ffb`5cac072e 7503            jne     ntdll!LdrpDoDebuggerBreak+0x33 (00007ffb`5cac0733)  Branchntdll!LdrpDoDebuggerBreak+0x30:
00007ffb`5cac0730 cc              int     3
00007ffb`5cac0731 eb00            jmp     ntdll!LdrpDoDebuggerBreak+0x33 (00007ffb`5cac0733)  Branchntdll!LdrpDoDebuggerBreak+0x33:
00007ffb`5cac0733 4883c438        add     rsp,38h
00007ffb`5cac0737 c3              ret
$ip 往后两条指令
0:000> u . L2
ntdll!LdrpDoDebuggerBreak+0x30:
00007ffb`5cac0730 cc              int     3
00007ffb`5cac0731 eb00            jmp     ntdll!LdrpDoDebuggerBreak+0x33 (00007ffb`5cac0733)
$ip往前两条指令
0:000> ub . L2
ntdll!LdrpDoDebuggerBreak+0x29:
00007ffb`5cac0729 807c244000      cmp     byte ptr [rsp+40h],0
00007ffb`5cac072e 7503            jne     ntdll!LdrpDoDebuggerBreak+0x33 (00007ffb`5cac0733)
i p 到 ip 到 ip到ip+a之间
0:000> u . .+a
ntdll!LdrpDoDebuggerBreak+0x30:
00007ffb`5cac0730 cc              int     3
00007ffb`5cac0731 eb00            jmp     ntdll!LdrpDoDebuggerBreak+0x33 (00007ffb`5cac0733)
00007ffb`5cac0733 4883c438        add     rsp,38h
00007ffb`5cac0737 c3              ret
00007ffb`5cac0738 cc              int     3
00007ffb`5cac0739 cc              int     3
00007ffb`5cac073a cc              int     3
What Is the Current Call Stack?当前调用栈是什么?
当进入函数时,编译器将生成栈帧(Stack Frame),栈帧的基指针是通过寄存器ebp来维护的。函数前导指令(Function prolog)将把ebp的当前值保存在栈上,然后将当前栈帧的基指针值加载到ebp中,这个值将被一直保留直到执行函数后继指令(Function Epilog)。在函数中,编译器通过将ebp与正偏移相加来获得函数输入参数的地址,通过将ebp与负偏黎相加来获得函数中分配的局部变量的地址。
0:000> uf 02Sample!KBTest::Fibonacci_stdcall
02Sample!KBTest::Fibonacci_stdcall [H:\Books\AdvWinDebug\AdvancedWindowsDebugging\Awd\02Sample\02Sample.cpp @ 114]:114 007039e0 55              push    ebp114 007039e1 8bec            mov     ebp,esp
...121 00703a7b 8be5            mov     esp,ebp121 00703a7d 5d              pop     ebp121 00703a7e c20400          ret     4
调用时保存ebp,最后还原ebp
[~Thread] k[b|p|P|v] [c] [n] [f] [L] [M] [FrameCount]
[~Thread] k[b|p|P|v] [c] [n] [f] [L] [M] = StackPtr FrameCount
[~Thread] k[b|p|P|v] [c] [n] [f] [L] [M] = StackPtr InstructionPtr FrameCount
[~Thread] kd [WordCount]
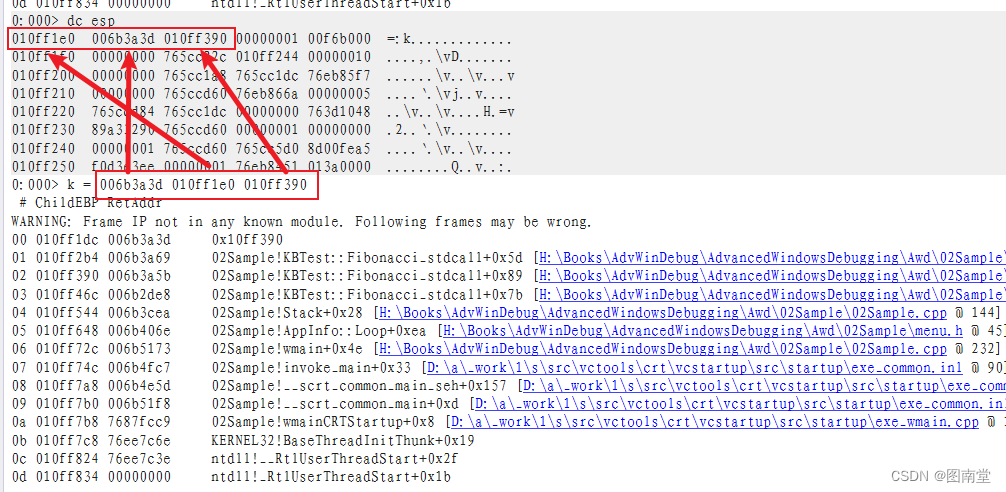
Display Stack Backtrace显示堆栈回溯
0:000> k
0:000> k# ChildEBP RetAddr
00 010ff1dc 006b3a3d     KERNELBASE!wil::details::DebugBreak+0x2
01 010ff2b4 006b3a69     02Sample!KBTest::Fibonacci_stdcall+0x5d [H:\Books\AdvWinDebug\AdvancedWindowsDebugging\Awd\02Sample\02Sample.cpp @ 117]
02 010ff390 006b3a5b     02Sample!KBTest::Fibonacci_stdcall+0x89 [H:\Books\AdvWinDebug\AdvancedWindowsDebugging\Awd\02Sample\02Sample.cpp @ 119]
03 010ff46c 006b2de8     02Sample!KBTest::Fibonacci_stdcall+0x7b [H:\Books\AdvWinDebug\AdvancedWindowsDebugging\Awd\02Sample\02Sample.cpp @ 119]
04 010ff544 006b3cea     02Sample!Stack+0x28 [H:\Books\AdvWinDebug\AdvancedWindowsDebugging\Awd\02Sample\02Sample.cpp @ 144]
05 010ff648 006b406e     02Sample!AppInfo::Loop+0xea [H:\Books\AdvWinDebug\AdvancedWindowsDebugging\Awd\02Sample\menu.h @ 45]
06 010ff72c 006b5173     02Sample!wmain+0x4e [H:\Books\AdvWinDebug\AdvancedWindowsDebugging\Awd\02Sample\02Sample.cpp @ 232]
07 010ff74c 006b4fc7     02Sample!invoke_main+0x33 [D:\a\_work\1\s\src\vctools\crt\vcstartup\src\startup\exe_common.inl @ 90]
08 010ff7a8 006b4e5d     02Sample!__scrt_common_main_seh+0x157 [D:\a\_work\1\s\src\vctools\crt\vcstartup\src\startup\exe_common.inl @ 288]
09 010ff7b0 006b51f8     02Sample!__scrt_common_main+0xd [D:\a\_work\1\s\src\vctools\crt\vcstartup\src\startup\exe_common.inl @ 331]
0a 010ff7b8 7687fcc9     02Sample!wmainCRTStartup+0x8 [D:\a\_work\1\s\src\vctools\crt\vcstartup\src\startup\exe_wmain.cpp @ 17]
0b 010ff7c8 76ee7c6e     KERNEL32!BaseThreadInitThunk+0x19
0c 010ff824 76ee7c3e     ntdll!__RtlUserThreadStart+0x2f
0d 010ff834 00000000     ntdll!_RtlUserThreadStart+0x1b
显示每个函数的前3个参数
0:000> kb# ChildEBP RetAddr      Args to Child
00 010ff1dc 006b3a3d     010ff390 00000001 00f6b000 KERNELBASE!wil::details::DebugBreak+0x2
01 010ff2b4 006b3a69     00000000 010ff46c 010ff54c 02Sample!KBTest::Fibonacci_stdcall+0x5d [H:\Books\AdvWinDebug\AdvancedWindowsDebugging\Awd\02Sample\02Sample.cpp @ 117]
02 010ff390 006b3a5b     00000002 010ff544 010ff54c 02Sample!KBTest::Fibonacci_stdcall+0x89 [H:\Books\AdvWinDebug\AdvancedWindowsDebugging\Awd\02Sample\02Sample.cpp @ 119]
00000002 参数值
03 010ff46c 006b2de8     00000003 010ff648 010ff54c 02Sample!KBTest::Fibonacci_stdcall+0x7b [H:\Books\AdvWinDebug\AdvancedWindowsDebugging\Awd\02Sample\02Sample.cpp @ 119]
00000003 参数值
04 010ff544 006b3cea     010ff72c 006b1375 00f6b000 02Sample!Stack+0x28 [H:\Books\AdvWinDebug\AdvancedWindowsDebugging\Awd\02Sample\02Sample.cpp @ 144]
05 010ff648 006b406e     006b1375 006b1375 00f6b000 02Sample!AppInfo::Loop+0xea [H:\Books\AdvWinDebug\AdvancedWindowsDebugging\Awd\02Sample\menu.h @ 45]
06 010ff72c 006b5173     00000001 013af480 013bae50 02Sample!wmain+0x4e [H:\Books\AdvWinDebug\AdvancedWindowsDebugging\Awd\02Sample\02Sample.cpp @ 232]
07 010ff74c 006b4fc7     ffd84942 006b1375 006b1375 02Sample!invoke_main+0x33 [D:\a\_work\1\s\src\vctools\crt\vcstartup\src\startup\exe_common.inl @ 90]
08 010ff7a8 006b4e5d     010ff7b8 006b51f8 010ff7c8 02Sample!__scrt_common_main_seh+0x157 [D:\a\_work\1\s\src\vctools\crt\vcstartup\src\startup\exe_common.inl @ 288]
09 010ff7b0 006b51f8     010ff7c8 7687fcc9 00f6b000 02Sample!__scrt_common_main+0xd [D:\a\_work\1\s\src\vctools\crt\vcstartup\src\startup\exe_common.inl @ 331]
0a 010ff7b8 7687fcc9     00f6b000 7687fcb0 010ff824 02Sample!wmainCRTStartup+0x8 [D:\a\_work\1\s\src\vctools\crt\vcstartup\src\startup\exe_wmain.cpp @ 17]
0b 010ff7c8 76ee7c6e     00f6b000 1e370f42 00000000 KERNEL32!BaseThreadInitThunk+0x19
0c 010ff824 76ee7c3e     ffffffff 76f08c09 00000000 ntdll!__RtlUserThreadStart+0x2f
0d 010ff834 00000000     006b1375 00f6b000 00000000 ntdll!_RtlUserThreadStart+0x1b
0:000> kp 5;*最后5个函数调用# ChildEBP RetAddr
00 010ff1dc 006b3a3d     KERNELBASE!wil::details::DebugBreak+0x2
01 010ff2b4 006b3a69     02Sample!KBTest::Fibonacci_stdcall(unsigned int n = 0)+0x5d [H:\Books\AdvWinDebug\AdvancedWindowsDebugging\Awd\02Sample\02Sample.cpp @ 117]
02 010ff390 006b3a5b     02Sample!KBTest::Fibonacci_stdcall(unsigned int n = 2)+0x89 [H:\Books\AdvWinDebug\AdvancedWindowsDebugging\Awd\02Sample\02Sample.cpp @ 119]
03 010ff46c 006b2de8     02Sample!KBTest::Fibonacci_stdcall(unsigned int n = 3)+0x7b [H:\Books\AdvWinDebug\AdvancedWindowsDebugging\Awd\02Sample\02Sample.cpp @ 119]
04 010ff544 006b3cea     02Sample!Stack(void)+0x28 [H:\Books\AdvWinDebug\AdvancedWindowsDebugging\Awd\02Sample\02Sample.cpp @ 144]
0:000> kP 5;*最后5个函数调用# ChildEBP RetAddr
00 010ff1dc 006b3a3d     KERNELBASE!wil::details::DebugBreak+0x2
01 010ff2b4 006b3a69     02Sample!KBTest::Fibonacci_stdcall(unsigned int n = 0)+0x5d [H:\Books\AdvWinDebug\AdvancedWindowsDebugging\Awd\02Sample\02Sample.cpp @ 117]
02 010ff390 006b3a5b     02Sample!KBTest::Fibonacci_stdcall(unsigned int n = 2)+0x89 [H:\Books\AdvWinDebug\AdvancedWindowsDebugging\Awd\02Sample\02Sample.cpp @ 119]
03 010ff46c 006b2de8     02Sample!KBTest::Fibonacci_stdcall(unsigned int n = 3)+0x7b [H:\Books\AdvWinDebug\AdvancedWindowsDebugging\Awd\02Sample\02Sample.cpp @ 119]
04 010ff544 006b3cea     02Sample!Stack(void)+0x28 [H:\Books\AdvWinDebug\AdvancedWindowsDebugging\Awd\02Sample\02Sample.cpp @ 144]
0:000> kf 5;*显示相邻帧之间的大小#   Memory  ChildEBP RetAddr
00           010ff1dc 006b3a3d     KERNELBASE!wil::details::DebugBreak+0x2
01        d8 010ff2b4 006b3a69     02Sample!KBTest::Fibonacci_stdcall+0x5d [H:\Books\AdvWinDebug\AdvancedWindowsDebugging\Awd\02Sample\02Sample.cpp @ 117]
02        dc 010ff390 006b3a5b     02Sample!KBTest::Fibonacci_stdcall+0x89 [H:\Books\AdvWinDebug\AdvancedWindowsDebugging\Awd\02Sample\02Sample.cpp @ 119]
03        dc 010ff46c 006b2de8     02Sample!KBTest::Fibonacci_stdcall+0x7b [H:\Books\AdvWinDebug\AdvancedWindowsDebugging\Awd\02Sample\02Sample.cpp @ 119]
04        d8 010ff544 006b3cea     02Sample!Stack+0x28 [H:\Books\AdvWinDebug\AdvancedWindowsDebugging\Awd\02Sample\02Sample.cpp @ 144]
Setting a Code Breakpoint在代码中设置断点
[~Thread] bp[ID] [Options] [Address [Passes]] [“CommandString”]
[~Thread] bu[ID] [Options] [Address [Passes]] [“CommandString”]
[~Thread] bm [Options] SymbolPattern [Passes] [“CommandString”]
Set Breakpoint设置断点
0号线程上的Fibonacci_stdcall 函数上设置断点,命令后执行 resp命令
0:004> ~0 bp 02Sample!KBTest::Fibonacci_stdcall "resp"
breakpoint 0 redefined
0:004> bl0 e Disable Clear  000639e0     0001 (0001)  0:~000 02Sample!KBTest::Fibonacci_stdcall "resp"
0:004> g
esp=010ffb3c
eax=000720f8 ebx=00f66000 ecx=000720f8 edx=00000001 esi=010ffc18 edi=010ffc10
eip=000639e0 esp=010ffb3c ebp=010ffc10 iopl=0         nv up ei pl zr na pe nc
cs=0023  ss=002b  ds=002b  es=002b  fs=0053  gs=002b             efl=00000246
02Sample!KBTest::Fibonacci_stdcall:
000639e0 55              push    ebp
0:000> .lastevent
Last event: 52bc.5668: Hit breakpoint 0debugger time: Sat Jan 13 21:45:45.672 2024 (UTC + 8:00)
在Fibonacci_stdcall函数上设置断点,命中后执行 resp和g命令
0:000> bp 02Sample!KBTest::Fibonacci_stdcall "resp;g;"
breakpoint 0 redefined
0:000> g
esp=010ff6d4
esp=010ff5f8
esp=010ff51c
esp=010ff51c
(5a24.4de8): Break instruction exception - code 80000003 (first chance)
eax=00000001 ebx=00fdb000 ecx=009f20f8 edx=00000001 esi=010ff448 edi=010ff518
eip=76553ce2 esp=010ff444 ebp=010ff518 iopl=0         nv up ei pl nz na po nc
cs=0023  ss=002b  ds=002b  es=002b  fs=0053  gs=002b             efl=00000202
KERNELBASE!wil::details::DebugBreak+0x2:
76553ce2 cc              int     3
在函数包含fibona的函数上设置断点
0:000> bm 02sample!*Fibona*0: 009e3770 @!"02Sample!KBTest::Fibonacci_cdecl"1: 009e39e0 @!"02Sample!KBTest::Fibonacci_stdcall"2: 009e3910 @!"02Sample!KBTest::Fibonacci_fpo"3: 009e3840 @!"02Sample!KBTest::Fibonacci_fastcall"4: 009e3ab0 @!"02Sample!KBTest::Fibonacci_thiscall"
bp是针对地址下断点(修改代码后,地址若变换,断点会失效)(新版windbg,地址失败后,会找对应的符号?)
bu是针对符号下断点(修改代码后,地址变换后仍有效)
bm也是针对符号,可支持匹配表达式
What Are the Variable Values?变量的值是什么
dv [Flags] [Pattern] Display Local Variables显示局部变量
unsigned int Fibonacci_thiscall(unsigned int n){m_lastN = n;int localN = n + gGlobal.m_ref;switch (n){case 0: STOP_ON_DEBUGGER; return 0;case 1: return 1;default:{return Fibonacci_thiscall(localN - 2) + Fibonacci_thiscall(localN - 3);}}}
0:000> g
Breakpoint 4 hit
eax=010ff78c ebx=00fdb000 ecx=010ff78c edx=00000001 esi=010ff7b0 edi=010ff79c
eip=009e3ab0 esp=010ff6b0 ebp=010ff7a8 iopl=0         nv up ei pl zr na pe nc
cs=0023  ss=002b  ds=002b  es=002b  fs=0053  gs=002b             efl=00000246
02Sample!KBTest::Fibonacci_thiscall:
009e3ab0 55              push    ebp
dv显示变量
0:000> dvthis = 0xccccccccn = 3localN = 0n17823436
dv /i 显示变量类型
0:000> dv /i
prv local             this = 0xcccccccc
prv param                n = 3
prv local           localN = 0n13629092
dv /t 显示变量数据类型
0:000> dv /t
class KBTest * this = 0xcccccccc
unsigned int n = 3
int localN = 0n13629092
dv /V|/v 显示相应变量的地址
0:000> dv /V this
00cff67c          <virtual frame cff684>-0x0008                  this = 0xcccccccc
0:000> dv /v this
00cff67c                     this = 0xcccccccc
当变量是复杂类型时(如结构体或类等),dv命令只显示地址,此时需要用到dt命令
dt [-DisplayOpts] [-SearchOpts] [module!]Name [[-SearchOpts] Field] [Address] [-l List]
dt [-DisplayOpts] Address [-l List]
dt -h
Display Type显示类型
0:000> dt this
Local var @ 0x4ff69c Type KBTest*
0xcccccccc +0x000 __VFN_table : ???? +0x004 m_lastN          : ??
Memory read error ccccccd0
0:000> dt KBTest 0x4ff69c
02Sample!KBTest+0x000 __VFN_table : 0xcccccccc +0x004 m_lastN          : 0n5240708
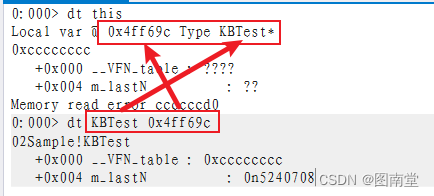
以上的值是错误的。
0:000> dt 02Sample!gGlobal
gGlobal+0x000 m_ref            : 0n3
如果你正在查看一个堆块,那么很有可能在堆块的起始位置上发现一个虚表(v-table),这表示在这个地址上是(或者曾经是)一个C++对象。
0:000> dc @ecx l4
004ff784  0098bc70 ffffffff cccccccc 92596447  p...........GdY.
0:000> ln 0098bc70
Browse module
Set bu breakpoint(0098bc70)   02Sample!KBTest::`vftable'   |  (0098bc78)   02Sample!`string'
Exact matches:02Sample!KBTest::`vftable' = <function> *[2]
0:000> dt KBTest @ecx
02Sample!KBTest+0x000 __VFN_table : 0x0098bc70 +0x004 m_lastN          : 0n-1
以上内容还需要细读原文
How Do You Inspect Memory?如果查看内存
d[type] [AddressRange] Display Memory显示内存
| 命令 | 说明 |
|---|---|
| da | ASCII字符 |
| db | 字节(Byte)和ASCII字符 |
| dc | 双字值(Double-word values,4 bytes)和ASCII字符 |
| dd | 双字值(Double-word values,4 bytes) |
| dD | 双精度浮点数(Double-precision floating-point numbers,8 bytes) |
| df | 单精度浮点数(Single-precision floating-point numbers,4 bytes |
| dp | 指针大小值(Pointer-sized values),相当于dd或dq |
| dq | 四字值(Quad-word values(8bytes) |
| du | Unicode字符 |
| dw | word值(2 bytes) |
| dW | word值(2 bytes)和 ASCII字符 |
| dyb | 二进制值和字节值 |
| dyd | 二进制什和双字值(4 bytes) |
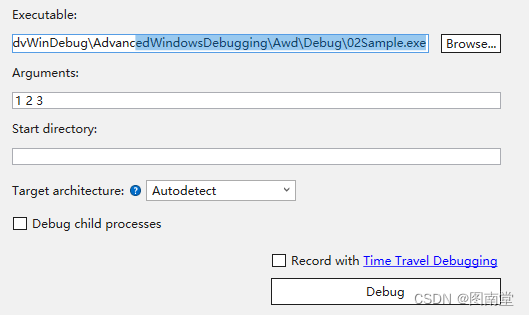
设置启动参数运行02Sample.exe
在程序入口下断点
0:000> bp 02Sample!wmain
0:000> dv /V argv;*参数argv的地址
00b9f710          <virtual frame b9f704>+0x000c                  argv = 0x00f0f3d8
0:000> dpu 0x00f0f3d8 L4
00f0f3d8  00f0f3ec "H:\Books\AdvWinDebug\AdvancedWindowsDebugging\Awd\Debug"
00f0f3dc  00f0f476 "1"
00f0f3e0  00f0f47a "2"
00f0f3e4  00f0f47e "3"
dds [Options] [Range]
dqs [Options] [Range]
dps [Options] [Range]
Display Words and Symbols显示文字和符号
0:000> dps ebp L4
00cff8d0  00cff92c
00cff8d4  006c4fc7 02Sample!__scrt_common_main_seh+0x157 [D:\a\_work\1\s\src\vctools\crt\vcstartup\src\startup\exe_common.inl @ 288]
00cff8d8  19e09d69
00cff8dc  006c1375 02Sample!ILT+880(_wmainCRTStartup)
ddp [Options] [Range]
dqp [Options] [Range]
dpp [Options] [Range]
dda [Options] [Range]
dqa [Options] [Range]
dpa [Options] [Range]
ddu [Options] [Range]
dqu [Options] [Range]
dpu [Options] [Range]
Display Referenced Memory显示引用内存
0:000> dv /V argv
00cff8bc          <virtual frame cff8b0>+0x000c                  argv = 0x00e9f3d8
0:000> dpu 0x00e9f3d8 L4
00e9f3d8  00e9f3ec "H:\Books\AdvWinDebug\AdvancedWindowsDebugging\Awd\Debug"
00e9f3dc  00e9f476 "1"
00e9f3e0  00e9f47a "2"
00e9f3e4  00e9f47e "3"
s [-[[Flags]Type]] Range Pattern
s -[[Flags]]v Range Object
s -[[Flags]]sa Range
s -[[Flags]]su Range
Search Memory搜索内存
内存前256MB中搜索异常码 C0000005
0:000> s -d 0 L10000000/4 C0000005
0096d9c0  c0000005 ffffffff 771f11bb 00000000  ...........w....
0096da80  c0000005 00000000 00000000 006c2d91  .............-l.
0096e0f8  c0000005 00000000 0000000f 00000000  ................
0096e110  c0000005 00000000 00000000 006c2d91  .............-l.
0096e9c0  c0000005 00000000 00000000 00000000  ................
00cfef04  c0000005 7aaa26d8 00cfefac 006b0000  .....&.z......k.
00cff0c0  c0000005 00000000 00000000 006c2d91  .............-l.
00cff330  c0000005 00000000 00000000 00000000  ................
00cff8fc  c0000005 00000000 00000000 006d0a4c  ............L.m.
00cff968  c0000005 00000000 754b27b0 6da95995  .........'Ku.Y.m
Setting a Breakpoint on Access设置内存访问断点
[~Thread] ba[ID] Access Size [Options] [Address [Passes]] [“CommandString”] Break on Access访问断点
其中Options:对应
e(execute) 执行时命中
r(read/write) 读写时命中
w(write) 写时命中
i(i/o) 内核模式时才可用
0:000>ba w4 gGlobal+0
What Does That Memory Location Contain?在内存位置上包含了什么?
!address Address
!address -summary
!address [-f:F1,F2,…] {[-o:{csv | tsv | 1}] | [-c:“Command”]}
!address -? | -help
显示目标进程或计算机的内存信息
0:000> .lastevent
Last event: 4ab4.25d4: Hit breakpoint 1debugger time: Sun Jan 14 20:36:48.173 2024 (UTC + 8:00)
0:000> !address .Usage:                  Image
Base Address:           006c1000
End Address:            006cb000
Region Size:            0000a000 (  40.000 kB)
State:                  00001000          MEM_COMMIT
Protect:                00000020          PAGE_EXECUTE_READ
Type:                   01000000          MEM_IMAGE
Allocation Base:        006b0000
Allocation Protect:     00000080          PAGE_EXECUTE_WRITECOPY
Image Path:             02Sample.exe
Module Name:            02Sample
Loaded Image Name:      H:\Books\AdvWinDebug\AdvancedWindowsDebugging\Awd\Debug\02Sample.exe
Mapped Image Name:
More info:              lmv m 02Sample
More info:              !lmi 02Sample
More info:              ln 0x6c39e0
More info:              !dh 0x6b0000Content source: 1 (target), length: 7620
Other Exploratory Commands其它分析命令
!peb [PEB-Address] 扩展显示进程环境块中信息的格式化图
Process environment block(PEB)
0:000> !peb
PEB at 01072000InheritedAddressSpace:    NoReadImageFileExecOptions: NoBeingDebugged:            YesImageBaseAddress:         006b0000NtGlobalFlag:             470NtGlobalFlag2:            0Ldr                       77325d80Ldr.Initialized:          YesLdr.InInitializationOrderModuleList: 01358198 . 013597a8Ldr.InLoadOrderModuleList:           01358290 . 01359940Ldr.InMemoryOrderModuleList:         01358298 . 01359948Base TimeStamp                     Module6b0000 65a29553 Jan 13 21:51:15 2024 H:\Books\AdvWinDebug\AdvancedWindowsDebugging\Awd\Debug\02Sample.exe77200000 3ab9e7d5 Mar 22 19:53:57 2001 C:\WINDOWS\SYSTEM32\ntdll.dll75eb0000 C:\WINDOWS\System32\KERNEL32.DLL752d0000 640b6fb9 Mar 11 01:58:17 2023 C:\WINDOWS\System32\KERNELBASE.dll7aa70000 C:\WINDOWS\SYSTEM32\VCRUNTIME140D.dll7aa90000 61aac1a9 Dec 04 09:17:29 2021 C:\WINDOWS\SYSTEM32\ucrtbased.dllSubSystemData:     00000000ProcessHeap:       01350000ProcessParameters: 013542b0CurrentDirectory:  'C:\WINDOWS\system32\'WindowTitle:  'H:\Books\AdvWinDebug\AdvancedWindowsDebugging\Awd\Debug\02Sample.exe'ImageFile:    'H:\Books\AdvWinDebug\AdvancedWindowsDebugging\Awd\Debug\02Sample.exe'CommandLine:  'H:\Books\AdvWinDebug\AdvancedWindowsDebugging\Awd\Debug\02Sample.exe'DllPath:      '< Name not readable >'Environment:  01350b80...
!peb [PEB-Address] 扩展显示线程环境块(thread environment block)中信息的格式化视图
0:000> !teb
TEB at 01075000ExceptionList:        012ffe68StackBase:            01300000StackLimit:           012fd000SubSystemTib:         00000000FiberData:            00001e00ArbitraryUserPointer: 00000000Self:                 01075000EnvironmentPointer:   00000000ClientId:             00004ab4 . 000025d4RpcHandle:            00000000Tls Storage:          01358c38PEB Address:          01072000LastErrorValue:       0LastStatusValue:      0Count Owned Locks:    0HardErrorMode:        0
!gle [-all] Get Last Error显示当前线程的最后一个错误值
2.2.12 Context-Changing Commands修改上下文的命令
Tracing Code Execution跟踪代码执行
[~Thread] t [r] [= StartAddress] [Count] [“Command”] Trace单步跟踪
只有当模块中包含私有符号时,才可以用源代码跟踪模式
0:000> l+t
Source options are 1:1/t - Step/trace by source line
0:000> l-t
Source options are 0:None
在当前线程中执行一条语句,而其他的线程将被挂起
0:000> ~.t
Stepping Over a Function Excetion逐过程
[~Thread] p[r] [= StartAddress] [Count] [“Command”] Step逐过程
跳过Fibonacci_stdcallKBTestSGIIZ函数
0:000> p
eax=00d320f8 ebx=0031c000 ecx=00d320f8 edx=00000001 esi=004ff854 edi=004ff84c
eip=00d22de3 esp=004ff77c ebp=004ff84c iopl=0         nv up ei pl zr na pe nc
cs=0023  ss=002b  ds=002b  es=002b  fs=0053  gs=002b             efl=00000246
02Sample!Stack+0x23:
00d22de3 e8b2e3ffff      call    02Sample!ILT+405(?Fibonacci_stdcallKBTestSGIIZ) (00d2119a)
0:000> p
eax=00000002 ebx=0031c000 ecx=00d320f8 edx=00000001 esi=004ff854 edi=004ff84c
eip=00d22de8 esp=004ff780 ebp=004ff84c iopl=0         nv up ei pl zr na pe nc
cs=0023  ss=002b  ds=002b  es=002b  fs=0053  gs=002b             efl=00000246
02Sample!Stack+0x28:
00d22de8 50              push    eax
[~Thread] pc [r] [= StartAddress] [Count] Step to Next Call逐过程到下一个Call
0:000> u 00d22dc1 L10
02Sample!Stack+0x1 [H:\Books\AdvWinDebug\AdvancedWindowsDebugging\Awd\02Sample\02Sample.cpp @ 143]:
00d22dc1 8bec            mov     ebp,esp
00d22dc3 81ecc0000000    sub     esp,0C0h
00d22dc9 53              push    ebx
00d22dca 56              push    esi
00d22dcb 57              push    edi
00d22dcc 8bfd            mov     edi,ebp
00d22dce 33c9            xor     ecx,ecx
00d22dd0 b8cccccccc      mov     eax,0CCCCCCCCh
00d22dd5 f3ab            rep stos dword ptr es:[edi]
00d22dd7 b9f820d300      mov     ecx,offset 02Sample!_NULL_IMPORT_DESCRIPTOR <PERF> (02Sample+0x220f8) (00d320f8)
00d22ddc e820e6ffff      call    02Sample!ILT+1020(__CheckForDebuggerJustMyCode (00d21401)
00d22de1 6a03            push    3
00d22de3 e8b2e3ffff      call    02Sample!ILT+405(?Fibonacci_stdcallKBTestSGIIZ) (00d2119a)
00d22de8 50              push    eax
00d22de9 6878bcd200      push    offset 02Sample!`string' (00d2bc78)
00d22dee e832e5ffff      call    02Sample!ILT+800(_wprintf) (00d21325)
0:000> pc
02Sample!Stack+0x1c:
00d22ddc e820e6ffff      call    02Sample!ILT+1020(__CheckForDebuggerJustMyCode (00d21401)
0:000> pc
02Sample!Stack+0x23:
00d22de3 e8b2e3ffff      call    02Sample!ILT+405(?Fibonacci_stdcallKBTestSGIIZ) (00d2119a)
Continuing Code Execution继续代码执行
[~Thread] g[a] [= StartAddress] [BreakAddress … [; BreakCommands]] Go继续
g address,执行到指定地址
0:000> u
02Sample!wmain [H:\Books\AdvWinDebug\AdvancedWindowsDebugging\Awd\02Sample\02Sample.cpp @ 229]:
00d23f50 55              push    ebp
00d23f51 8bec            mov     ebp,esp
00d23f53 81ecd0000000    sub     esp,0D0h
00d23f59 53              push    ebx
00d23f5a 56              push    esi
00d23f5b 57              push    edi
00d23f5c 8d7df0          lea     edi,[ebp-10h]
00d23f5f b904000000      mov     ecx,4
0:000> rm 0
0:000> g 00d23f5f
02Sample!wmain+0xf:
00d23f5f b904000000      mov     ecx,4
[~Thread] gu Go Up跳出当前函数
Tracing and Watching a Function Execution跟踪和观察一个函数的执行
wt [WatchOptions] [= StartAddress] [EndAddress] Trace and Watch Data跟踪和观察数据
0:000> wt -l1;*显示1级调用
Tracing 02Sample!Stack to return address 00d23c1a12     0 [  0] 02Sample!Stack1     0 [  1]   02Sample!ILT+1020(__CheckForDebuggerJustMyCode15     0 [  1]   02Sample!__CheckForDebuggerJustMyCode14    16 [  0] 02Sample!Stack1     0 [  1]   02Sample!ILT+405(?Fibonacci_stdcallKBTestSGIIZ)38     0 [  1]   02Sample!KBTest::Fibonacci_stdcall
>> No match on ret53     0 [  1]   02Sample!KBTest::Fibonacci_stdcall17    70 [  0] 02Sample!Stack1     0 [  1]   02Sample!ILT+800(_wprintf)48     0 [  1]   02Sample!wprintf24   119 [  0] 02Sample!Stack1     0 [  1]   02Sample!ILT+765(__RTC_CheckEsp)2     0 [  1]   02Sample!_RTC_CheckEsp27   122 [  0] 02Sample!Stack149 instructions were executed in 148 events (0 from other threads)Function Name                               Invocations MinInst MaxInst AvgInst
02Sample!ILT+1020(__CheckForDebuggerJustMyCode        1       1       1       1
02Sample!ILT+405(?Fibonacci_stdcallKBTestSGIIZ)       1       1       1       1
02Sample!ILT+765(__RTC_CheckEsp)                      1       1       1       1
02Sample!ILT+800(_wprintf)                            1       1       1       1
02Sample!KBTest::Fibonacci_stdcall                    1      53      53      53
02Sample!Stack                                        1      27      27      27
02Sample!_RTC_CheckEsp                                1       2       2       2
02Sample!__CheckForDebuggerJustMyCode                 1      15      15      15
02Sample!wprintf                                      1      48      48      480 system calls were executed02Sample!AppInfo::Loop+0xea:
00d23c1a 3bf4            cmp     esi,esp
Changing the Context修改上下文
.cxr [Options] [Address] Display Context Record显示上下文记录
0:000> s -d 0 L10000000/4 0001003f
005dfd24  0001003f 00000000 00000000 00000000  ?...............
0094fd24  0001003f 00000000 00000000 00000000  ?...............
0098fd24  0001003f 00000000 00000000 00000000  ?...............
00aa76a0  0001003f 0001004d 00000000 00000400  ?...M...........
00aefd24  0001003f 00000000 00000000 00000000  ?...............
0104f548  0001003f 00000068 00000000 00000000  ?...h...........
0:000> .cxr 005dfd24
eax=00000000 ebx=00000000 ecx=00000000 edx=00000000 esi=008ff4f4 edi=00d313f2
eip=77052ddc esp=008ff470 ebp=008ff4d0 iopl=0         nv up ei pl nz ac po nc
cs=0023  ss=002b  ds=002b  es=002b  fs=0053  gs=002b             efl=00000212
ntdll!NtQueryVirtualMemory+0xc:
77052ddc c21800          ret     18h
~ Thread Thread Status线程状态
显示当前进程的所有线程状态
0:000> ~
.  0  Id: 2520.13d8 Suspend: 1 Teb: 007e2000 Unfrozen1  Id: 2520.323c Suspend: 1 Teb: 007e5000 Unfrozen2  Id: 2520.cac Suspend: 1 Teb: 007e8000 Unfrozen3  Id: 2520.f60 Suspend: 1 Teb: 007eb000 Unfrozen
0:000> ~*
.  0  Id: 2520.13d8 Suspend: 1 Teb: 007e2000 UnfrozenStart: 02Sample!ILT+880(_wmainCRTStartup) (00d31375)Priority: 0  Priority class: 32  Affinity: ff1  Id: 2520.323c Suspend: 1 Teb: 007e5000 UnfrozenStart: ntdll!TppWorkerThread (77015940)Priority: 0  Priority class: 32  Affinity: ff2  Id: 2520.cac Suspend: 1 Teb: 007e8000 UnfrozenStart: ntdll!TppWorkerThread (77015940)Priority: 0  Priority class: 32  Affinity: ff3  Id: 2520.f60 Suspend: 1 Teb: 007eb000 UnfrozenStart: ntdll!TppWorkerThread (77015940)Priority: 0  Priority class: 32  Affinity: ff
显示当前激活的进线
0:000> ~.
.  0  Id: 2520.13d8 Suspend: 1 Teb: 007e2000 UnfrozenStart: 02Sample!ILT+880(_wmainCRTStartup) (00d31375)Priority: 0  Priority class: 32  Affinity: ff
显示1号线程的状态
0:000> ~11 Id: 2520.323c Suspend: 1 Teb: 007e5000 UnfrozenStart: ntdll!TppWorkerThread (77015940)Priority: 0 Priority class: 32 Affinity: ff
显示最初导致异常的线程(或者调试器附加到进程时处于活动状态的线程)
0:001> ~#
#  0  Id: 2520.13d8 Suspend: 1 Teb: 007e2000 UnfrozenStart: 02Sample!ILT+880(_wmainCRTStartup) (00d31375)Priority: 0  Priority class: 32  Affinity: ff
0:001> ~
#  0  Id: 2520.13d8 Suspend: 1 Teb: 007e2000 Unfrozen
.  1  Id: 2520.323c Suspend: 1 Teb: 007e5000 Unfrozen2  Id: 2520.cac Suspend: 1 Teb: 007e8000 Unfrozen3  Id: 2520.f60 Suspend: 1 Teb: 007eb000 Unfrozen
~Thread s
~ s
Set Current Thread设置/显示当前线程
0:001> ~ s
eax=00000000 ebx=00b59c60 ecx=00000000 edx=00000000 esi=00b59c60 edi=00b587b8
eip=770548fc esp=00e4fbcc ebp=00e4fd88 iopl=0         nv up ei pl nz na pe nc
cs=0023  ss=002b  ds=002b  es=002b  fs=0053  gs=002b             efl=00000206
ntdll!NtWaitForWorkViaWorkerFactory+0xc:
770548fc c21400          ret     14h
0:001> ~2 s
eax=00000000 ebx=00b59ec0 ecx=00000000 edx=00000000 esi=00b59ec0 edi=00b587b8
eip=770548fc esp=00f4fb28 ebp=00f4fce4 iopl=0         nv up ei pl nz na pe nc
cs=0023  ss=002b  ds=002b  es=002b  fs=0053  gs=002b             efl=00000206
ntdll!NtWaitForWorkViaWorkerFactory+0xc:
770548fc c21400          ret     14h
0:002> ~ s
eax=00000000 ebx=00b59ec0 ecx=00000000 edx=00000000 esi=00b59ec0 edi=00b587b8
eip=770548fc esp=00f4fb28 ebp=00f4fce4 iopl=0         nv up ei pl nz na pe nc
cs=0023  ss=002b  ds=002b  es=002b  fs=0053  gs=002b             efl=00000206
ntdll!NtWaitForWorkViaWorkerFactory+0xc:
770548fc c21400          ret     14h
.frame [/c] [/r] [FrameNumber]
.frame [/c] [/r] = BasePtr [FrameIncrement]
.frame [/c] [/r] = BasePtr StackPtr InstructionPtr
Set Local Context设置本地上下文
0:000> .frame /r
00 012ffcac 00d350a3     02Sample!wmain [H:\Books\AdvWinDebug\AdvancedWindowsDebugging\Awd\02Sample\02Sample.cpp @ 229]
eax=015bf3c0 ebx=01107000 ecx=00000001 edx=015cae40 esi=00d31375 edi=00d31375
eip=00d33f50 esp=012ffcb0 ebp=012ffcac iopl=0         nv up ei pl nz na po nc
cs=0023  ss=002b  ds=002b  es=002b  fs=0053  gs=002b             efl=00000202
02Sample!wmain:
00d33f50 55              push    ebp
0:000> dvargc = 1argv = 0x015bf3c0appInfo = class AppInfo
当关上下文位于wMain,运行.frame 4后,dv显示变量位于02Sample!wmainCRTStartup+0x8
0:000> k# ChildEBP RetAddr
00 012ffcac 00d350a3     02Sample!wmain [H:\Books\AdvWinDebug\AdvancedWindowsDebugging\Awd\02Sample\02Sample.cpp @ 229]
01 012ffccc 00d34ef7     02Sample!invoke_main+0x33 [D:\a\_work\1\s\src\vctools\crt\vcstartup\src\startup\exe_common.inl @ 90]
02 012ffd28 00d34d8d     02Sample!__scrt_common_main_seh+0x157 [D:\a\_work\1\s\src\vctools\crt\vcstartup\src\startup\exe_common.inl @ 288]
03 012ffd30 00d35128     02Sample!__scrt_common_main+0xd [D:\a\_work\1\s\src\vctools\crt\vcstartup\src\startup\exe_common.inl @ 331]
04 012ffd38 754efcc9     02Sample!wmainCRTStartup+0x8 [D:\a\_work\1\s\src\vctools\crt\vcstartup\src\startup\exe_wmain.cpp @ 17]
05 012ffd48 77047c6e     KERNEL32!BaseThreadInitThunk+0x19
06 012ffda4 77047c3e     ntdll!__RtlUserThreadStart+0x2f
07 012ffdb4 00000000     ntdll!_RtlUserThreadStart+0x1b
0:000> .frame 4
04 012ffd38 754efcc9     02Sample!wmainCRTStartup+0x8 [D:\a\_work\1\s\src\vctools\crt\vcstartup\src\startup\exe_wmain.cpp @ 17]
0:000> dv__formal = 0x01107000
Entering Value输入值
e{b|d|D|f|p|q|w} Address [Values]
e{a|u|za|zu} Address “String”
e Address [Values]
Enter Values输入值(修改内存值)
将变量n从3改为4
0:000> g
Breakpoint 3 hit
eax=00d420f8 ebx=01107000 ecx=00d420f8 edx=00000001 esi=012ffacc edi=012ffac4
eip=00d33970 esp=012ff9f0 ebp=012ffac4 iopl=0         nv up ei pl zr na pe nc
cs=0023  ss=002b  ds=002b  es=002b  fs=0053  gs=002b             efl=00000246
02Sample!KBTest::Fibonacci_stdcall:
00d33970 55              push    ebp
0:000> k# ChildEBP RetAddr
00 012ff9ec 00d32de8     02Sample!KBTest::Fibonacci_stdcall [H:\Books\AdvWinDebug\AdvancedWindowsDebugging\Awd\02Sample\02Sample.cpp @ 114]
01 012ffac4 00d33c1a     02Sample!Stack+0x28 [H:\Books\AdvWinDebug\AdvancedWindowsDebugging\Awd\02Sample\02Sample.cpp @ 144]
02 012ffbc8 00d33f9e     02Sample!AppInfo::Loop+0xea [H:\Books\AdvWinDebug\AdvancedWindowsDebugging\Awd\02Sample\menu.h @ 45]
03 012ffcac 00d350a3     02Sample!wmain+0x4e [H:\Books\AdvWinDebug\AdvancedWindowsDebugging\Awd\02Sample\02Sample.cpp @ 232]
04 012ffccc 00d34ef7     02Sample!invoke_main+0x33 [D:\a\_work\1\s\src\vctools\crt\vcstartup\src\startup\exe_common.inl @ 90]
05 012ffd28 00d34d8d     02Sample!__scrt_common_main_seh+0x157 [D:\a\_work\1\s\src\vctools\crt\vcstartup\src\startup\exe_common.inl @ 288]
06 012ffd30 00d35128     02Sample!__scrt_common_main+0xd [D:\a\_work\1\s\src\vctools\crt\vcstartup\src\startup\exe_common.inl @ 331]
07 012ffd38 754efcc9     02Sample!wmainCRTStartup+0x8 [D:\a\_work\1\s\src\vctools\crt\vcstartup\src\startup\exe_wmain.cpp @ 17]
08 012ffd48 77047c6e     KERNEL32!BaseThreadInitThunk+0x19
09 012ffda4 77047c3e     ntdll!__RtlUserThreadStart+0x2f
0a 012ffdb4 00000000     ntdll!_RtlUserThreadStart+0x1b
0:000> dvn = 3
0:000> ed n 4
0:000> dvn = 4
修改内存指令为nop
eb .-6 90 90 90 90 90 90
2.2.13 Other Helper Commands其他辅助命令
!error Value [Flags] 查看错误代码的意义
0:000> !error 2
Error code: (NTSTATUS) 0x2 (2) - STATUS_WAIT_2
0:000> !error 5;*没有正确显示???
Error code: (Win32) 0x5 (5) - <Unable to get error code text>
!dreg [-d|-w] KeyPath[!Value]
!dreg
Display Registry Information显示注册表内容
0:000> !dreg Software\Microsoft\Windows NT\CurrentVersion\AeDebug!*
Value: "UserDebuggerHotKey" - REG_DWORD: 0 = 0x00000000
------------------------------------------------------------------------
Value: "Debugger" - REG_SZ: ""C:\WINDOWS\system32\vsjitdebugger.exe" -p %ld -e %ld -j 0x%p"
------------------------------------------------------------------------
Value: "Auto" - REG_SZ: "1"
------------------------------------------------------------------------
? Expression Evaluate Expression计算表达式
0:000> dvn = 1
0:000> ? poi(n)
Evaluate expression: 1 = 00000001
?? Expression Evaluate C++ Expression计算C++表达式
0:000> ? poi(n)
Evaluate expression: 1 = 00000001
0:000> ?? n
unsigned int 1
.formats expression Show Number Formats显示数字格式
0:000> .formats 0x8
Evaluate expression:Hex:     00000008Decimal: 8Decimal (unsigned) : 8Octal:   00000000010Binary:  00000000 00000000 00000000 00001000Chars:   ....Time:    Thu Jan  1 08:00:08 1970Float:   low 1.12104e-044 high 0Double:  3.95253e-323
.hh [Text] Open HTML Help File打开帮助文档
2.2.14 Examples示例
Conditional Breakpoints条件断点
0:000> bp 02Sample!KBTest::Fibonacci_stdcall ".if(eax!=1){g}"
breakpoint 0 redefined
0:000> g
eax=00000001 ebx=004d3000 ecx=00b420f8 edx=00000001 esi=006ff9c8 edi=006ff730
eip=00b376e0 esp=006ff658 ebp=006ff730 iopl=0         nv up ei pl nz na po nc
cs=0023  ss=002b  ds=002b  es=002b  fs=0053  gs=002b             efl=00000202
02Sample!KBTest::Fibonacci_stdcall:
00b376e0 55              push    ebp
kd> !process 0 0 cmd.exe
PROCESS
ffba1020 SessionId: 0 Cid: 01a4 Peb: 7ffd5000 ParentCid: 05d4
DirBase: 0567e000 ObjectTable: e17c2b60 HandleCount: 30.
Image: cmd.exe
kd> !object
ffba1020
Object: ffba1020 Type: (812ee900) Process
ObjectHeader: ffba1008
HandleCount: 1 PointerCount: 8
kd> dt nt!_OBJECT_HEADER ffba1008
+0x000 PointerCount : 8
+0x004 HandleCount : 1
...
kd> ba w4
ffba1008+8
kd> g
Breakpoint 2 hit
nt!ObpFreeObject+0x16c:
80563f66 5e pop esi
kd> k
ChildEBP RetAddr
fafb3cd0 80563ffe nt!ObpFreeObject+0x16c
fafb3ce8 804e3c55 nt!ObpRemoveObjectRoutine+0xe7
fafb3d0c 8057e5fb nt!ObfDereferenceObject+0x5f
fafb3d24 80563ff6 nt!PspThreadDelete+0xea
fafb3d40 804e3c55 nt!ObpRemoveObjectRoutine+0xdf
fafb3d64 804f9c5c nt!ObfDereferenceObject+0x5f
fafb3d74 804e47fe nt!PspReaper+0x4a
fafb3dac 8057dfed nt!ExpWorkerThread+0x100
109Remote Debugging
fafb3ddc 804fa477 nt!PspSystemThreadStartup+0x34
00000000 00000000 nt!KiThreadStartup+0x16
kd> dt nt!_OBJECT_HEADER
ffba1008
+0x000 PointerCount : 0
+0x004 HandleCount : 0
...
2.3 Remote Debugging 远程调试
Remote.exe
dbgsrv.exe
kdsrv.exe
后续再完善