openresty + prometheus + grafana 搭建。监控网络请求
1. 环境说明
centos 7
openresty 相当于 nginx + lua
prometheus 定时任务采集数据
grafana 数据大屏
2. 安装步骤
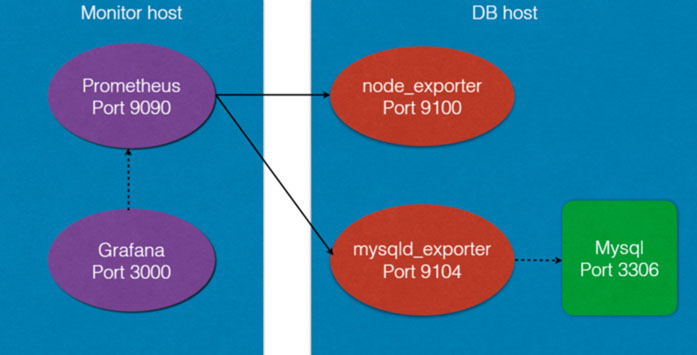
架构说明,我们这里采集的不是 node_exporter 的数据,而是 openresty 的数据
2.1 安装 配置 openresty
# 安装 yum 工具包
yum install yum-utils
yum-config-manager --add-repo https://openresty.org/package/centos/openresty.repo
yum install openresty
将nginx 配置放到 openresty 目录下
cp /path-of-nginx/conf.d/* /usr/local/openresty/nginx/conf/conf.d/
修改nginx.conf 配置
添加如下内容
log_format main '{ '
        '"@timestamp": "$time_iso8601", '
        '"request_method": "$request_method", '
        '"request_uri": "$request_uri", '
        '"request_length": "$request_length", '
        '"server_protocol": "$server_protocol", '
        '"remote_addr": "$remote_addr", '
        '"referer": "$http_referer", '
        '"status": $status, '
        '"bytes": $body_bytes_sent, '
        '"agent": "$http_user_agent", '
        '"x_forwarded": "$http_x_forwarded_for", '
        '"host": "$http_host", '
        '"up_addr": "$upstream_addr",'
        '"up_host": "$upstream_http_host",'
        '"up_resp_time": "$upstream_response_time",'
        '"request_time": "$request_time",'
        '"req_id": "$http_req_id"'
        ' }';


    access_log  /var/log/nginx/access.log  main;
    include /usr/local/openresty/nginx/conf/conf.d/*.conf;
openresty 的常用命令
# 启动
openresty -c <configuration file>
# 快速停止
openresty -s stop
# 完整有序的停止
openresty -s quit
# 修改配置后重新加载生效
openresty -s reload
# 重新打开日志文件
openresty -s  reopen
2.2 配置nginx-lua-prometheus
在/usr/local/openresty/lualib
git clone https://gitee.com/mirrors_knyar/nginx-lua-prometheus.git
nginx.conf 添加如下内容,加载脚本
http {
	..........省略
	lua_shared_dict prometheus_metrics 10M;
    lua_package_path "/usr/local/openresty/lualib/nginx-lua-prometheus/?.lua;;";
    init_worker_by_lua_block {
        prometheus = require("prometheus").init("prometheus_metrics")
        metric_requests = prometheus:counter(
          "nginx_http_requests_total", "Number of HTTP requests", {"host", "status"})
        metric_latency = prometheus:histogram(
          "nginx_http_request_duration_seconds", "HTTP request latency", {"host"})
        metric_connections = prometheus:gauge(
          "nginx_http_connections", "Number of HTTP connections", {"state"})
     }
     log_by_lua_block {
        metric_requests:inc(1, {ngx.var.server_name, ngx.var.status})
        metric_latency:observe(tonumber(ngx.var.request_time), {ngx.var.server_name})
     }
	..........省略
     server {
        listen       80;
        server_name  localhost;
        ......省略
        # 配置metrics路径,因为promethus需要定时调用nginx来获取信息的,所以需要提供一个metrics来获取信息,再nginx.conf中配置
		location /metrics {
            content_by_lua_block {
                metric_connections:set(ngx.var.connections_reading, {"reading"})
                metric_connections:set(ngx.var.connections_waiting, {"waiting"})
                metric_connections:set(ngx.var.connections_writing, {"writing"})
                prometheus:collect()
            }
		}
		......省略
	}
}
2.3 安装 prometheus
# 下载
wget https://github.com/prometheus/prometheus/releases/download/v2.38.0/prometheus-2.38.0.linux-amd64.tar.gz
# 解压
tar -xf prometheus-2.38.0.linux-amd64.tar.gz -C /usr/local/
# 重命名,设置软连接
cd /usr/local/ && mv prometheus-2.28.1.linux-amd64  prometheus
ln -s /usr/local/prometheus/prometheus   /usr/bin/prometheus
编辑service 文件
vim /usr/lib/systemd/system/prometheus.service
添加如下内容
[Unit]
Description=Prometheus
Documentation=https://prometheus.io/
After=network.target

[Service]
WorkingDirectory=/usr/local/prometheus/
ExecStart=/usr/local/prometheus/prometheus
ExecReload=/bin/kill -HUP $MAINPID
ExecStop=/bin/kill -KILL $MAINPID
Type=simple
KillMode=control-group
Restart=on-failure
RestartSec=15s

[Install]
WantedBy=multi-user.target
重载配置文件
systemctl daemon-reload
# 启动
 systemctl start prometheus
# 查看prometheus端口监听
netstat -lntp | grep prometheus
# 状态
systemctl status prometheus
# 停止
systemctl stop prometheus
在 /usr/local/prometheus/prometheus.yml 添加如下内容
alerting:
  alertmanagers:
    - static_configs:
        - targets:
          # - alertmanager:9093

# Load rules once and periodically evaluate them according to the global 'evaluation_interval'.
rule_files:
  # - "first_rules.yml"
  # - "second_rules.yml"

# A scrape configuration containing exactly one endpoint to scrape:
# Here it's Prometheus itself.
scrape_configs:
  # The job name is added as a label `job=<job_name>` to any timeseries scraped from this config.
  - job_name: "prometheus"

    # metrics_path defaults to '/metrics'
    # scheme defaults to 'http'.

    static_configs:
      - targets: ["localhost:9090"]
# 添加的内容部分
  - job_name: "cyl_nginx"
    metrics_path: /metrics
    static_configs:
    - targets: ["localhost:80"]
2.4 安装 grafana
vim /etc/yum.repos.d/grafana.repo
添加如下内容
[grafana]
name=grafana
baseurl=https://packages.grafana.com/oss/rpm
repo_gpgcheck=1
enabled=1
gpgcheck=1
gpgkey=https://packages.grafana.com/gpg.key
sslverify=1
sslcacert=/etc/pki/tls/certs/ca-bundle.crt
安装, 启动
yum install -y grafana
systemctl daemon-reload
systemctl start grafana-server
systemctl status grafana-server
配置 nginx
注意修改 server_name
server {
    listen       80;
    server_name  your-server-name;

    location / {
        add_header 'Access-Control-Allow-Origin' '*';
        add_header Access-Control-Allow-Methods GET,POST,OPTIONS,DELETE;
        add_header 'Access-Control-Allow-Headers' 'userId,DNT,X-CustomHeader,Keep-Alive,User-Agent,X-Requested-With,If-Modified-Since,Cache-Control,Content-Type';
        proxy_pass http://127.0.0.1:3000;
        rewrite ^/grafana/(.*) /$1 break;
        proxy_set_header   Host $host;
    }
}
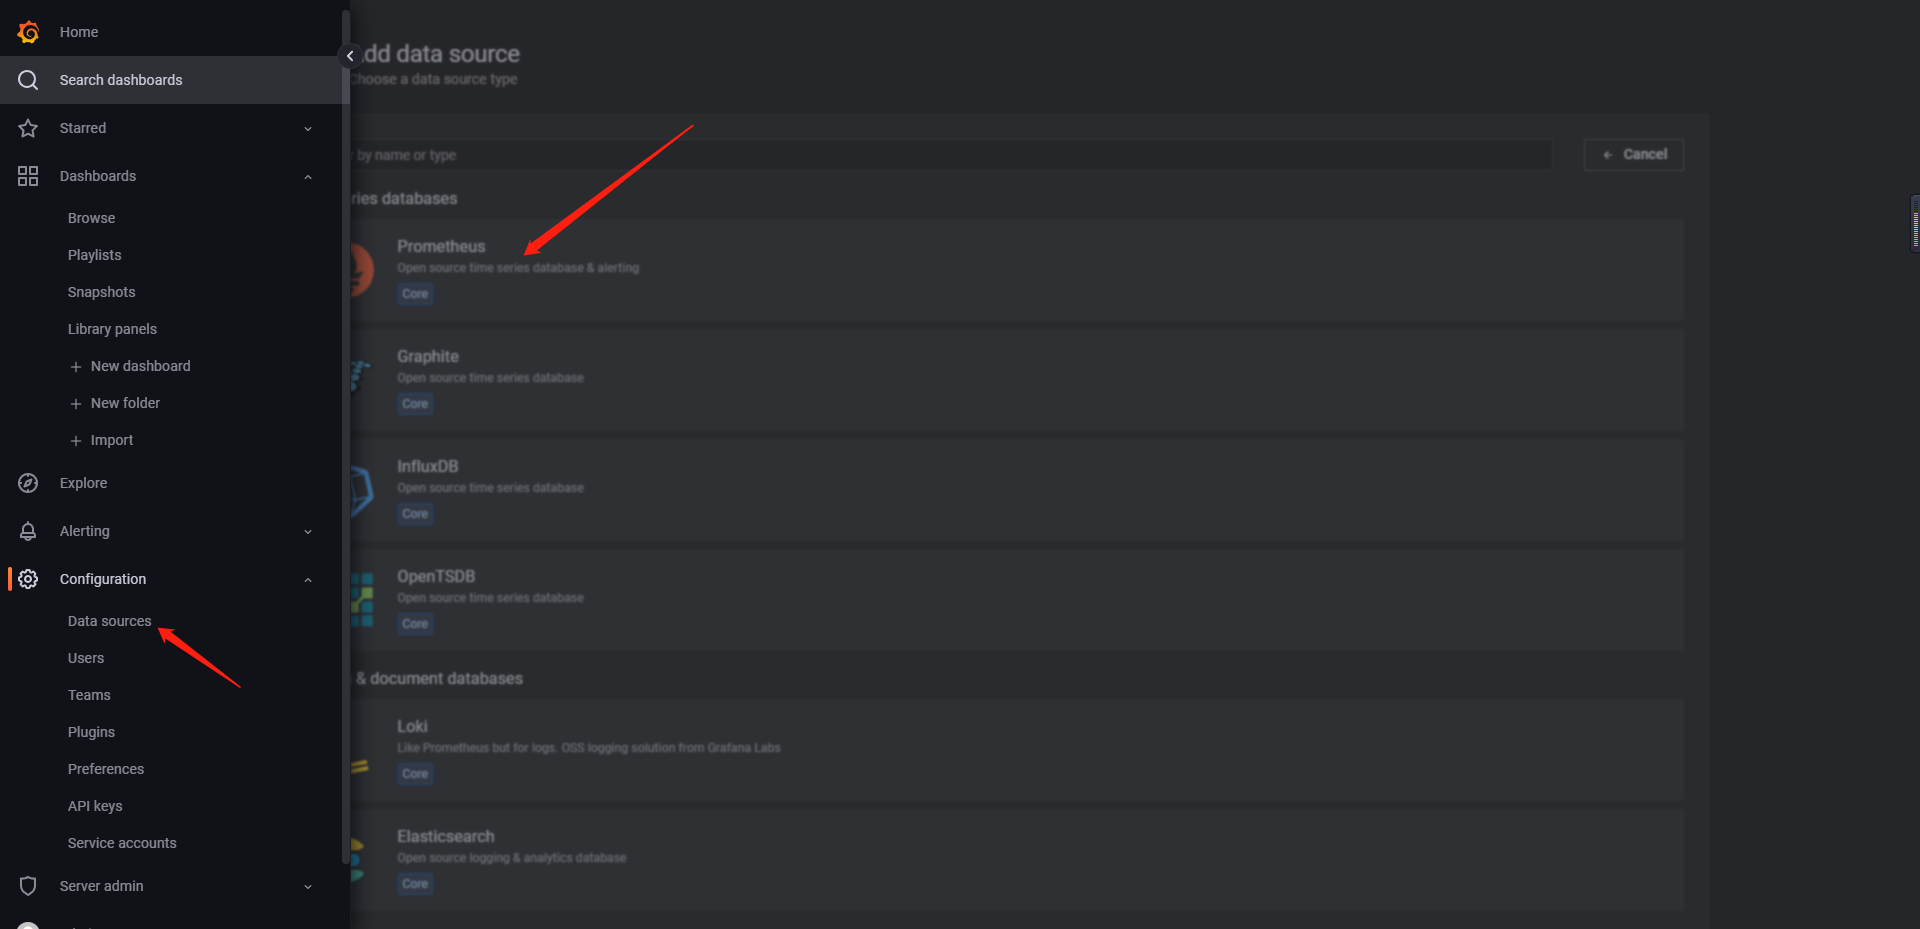
导入 prometheus 数据源
输入 URL
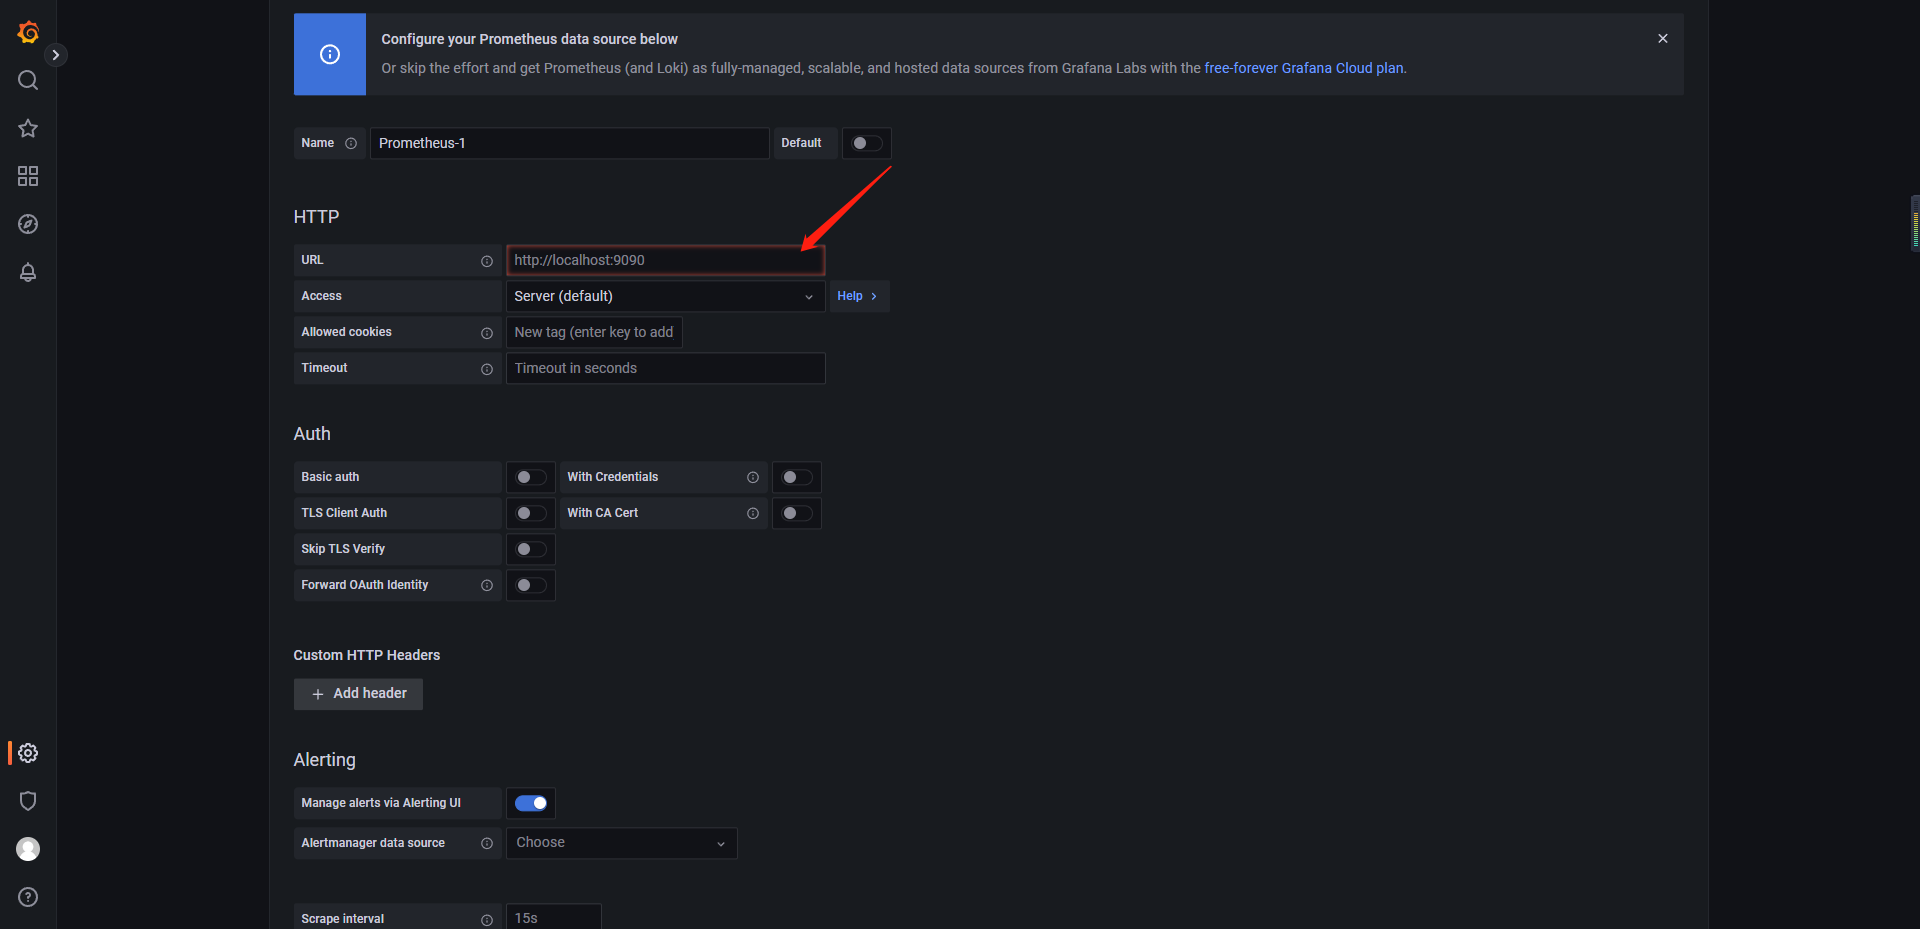
保存即可
创建dashboard
打开 https://grafana.com/grafana/dashboards/10223-nginx-lua/
复制 id
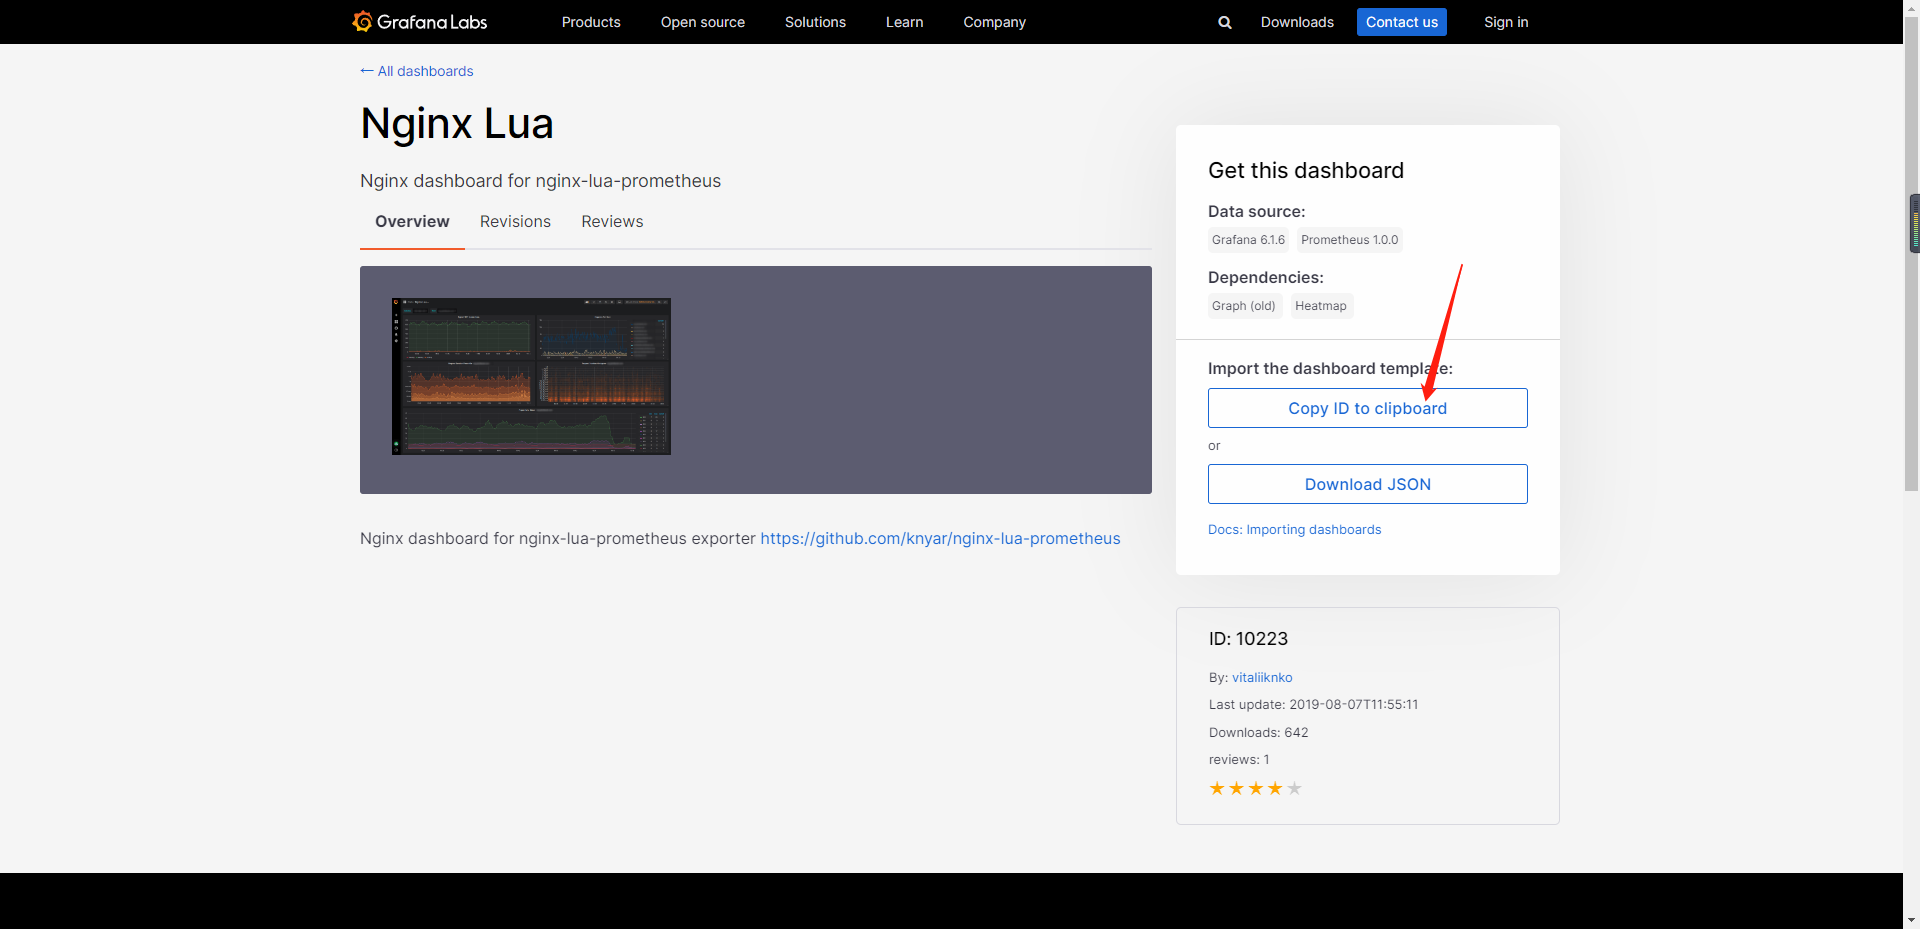
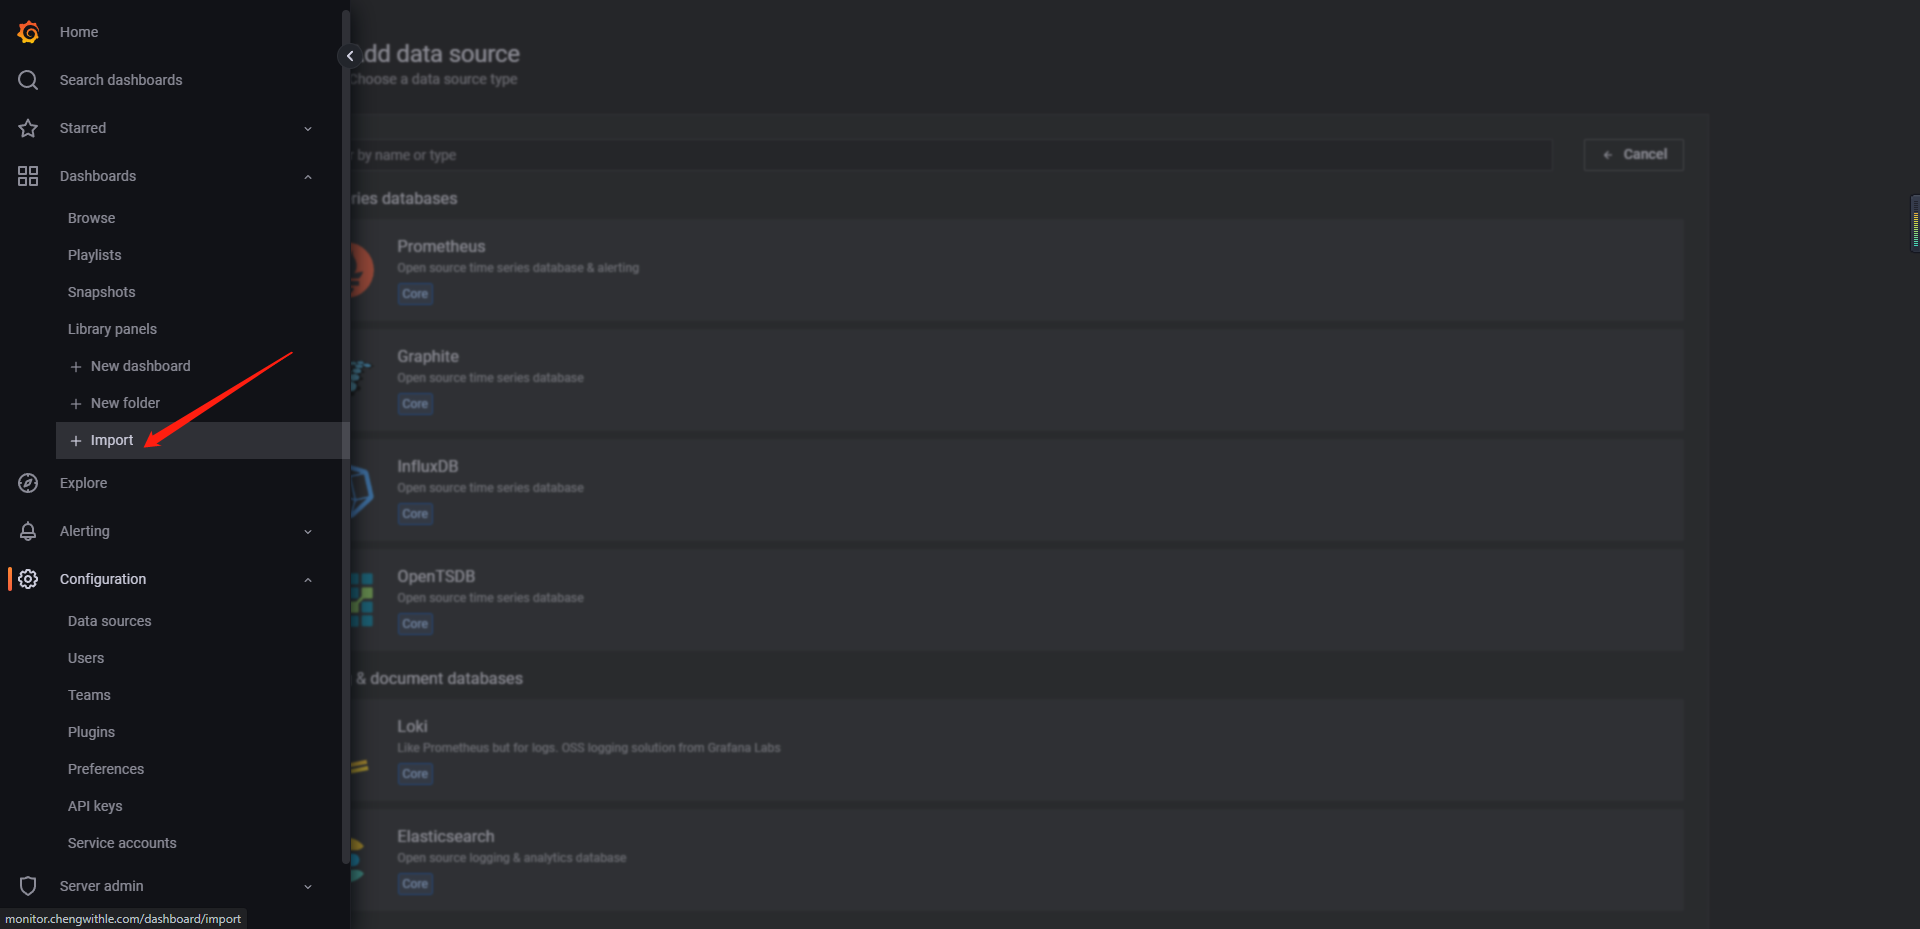
粘贴复制的id,点击 load
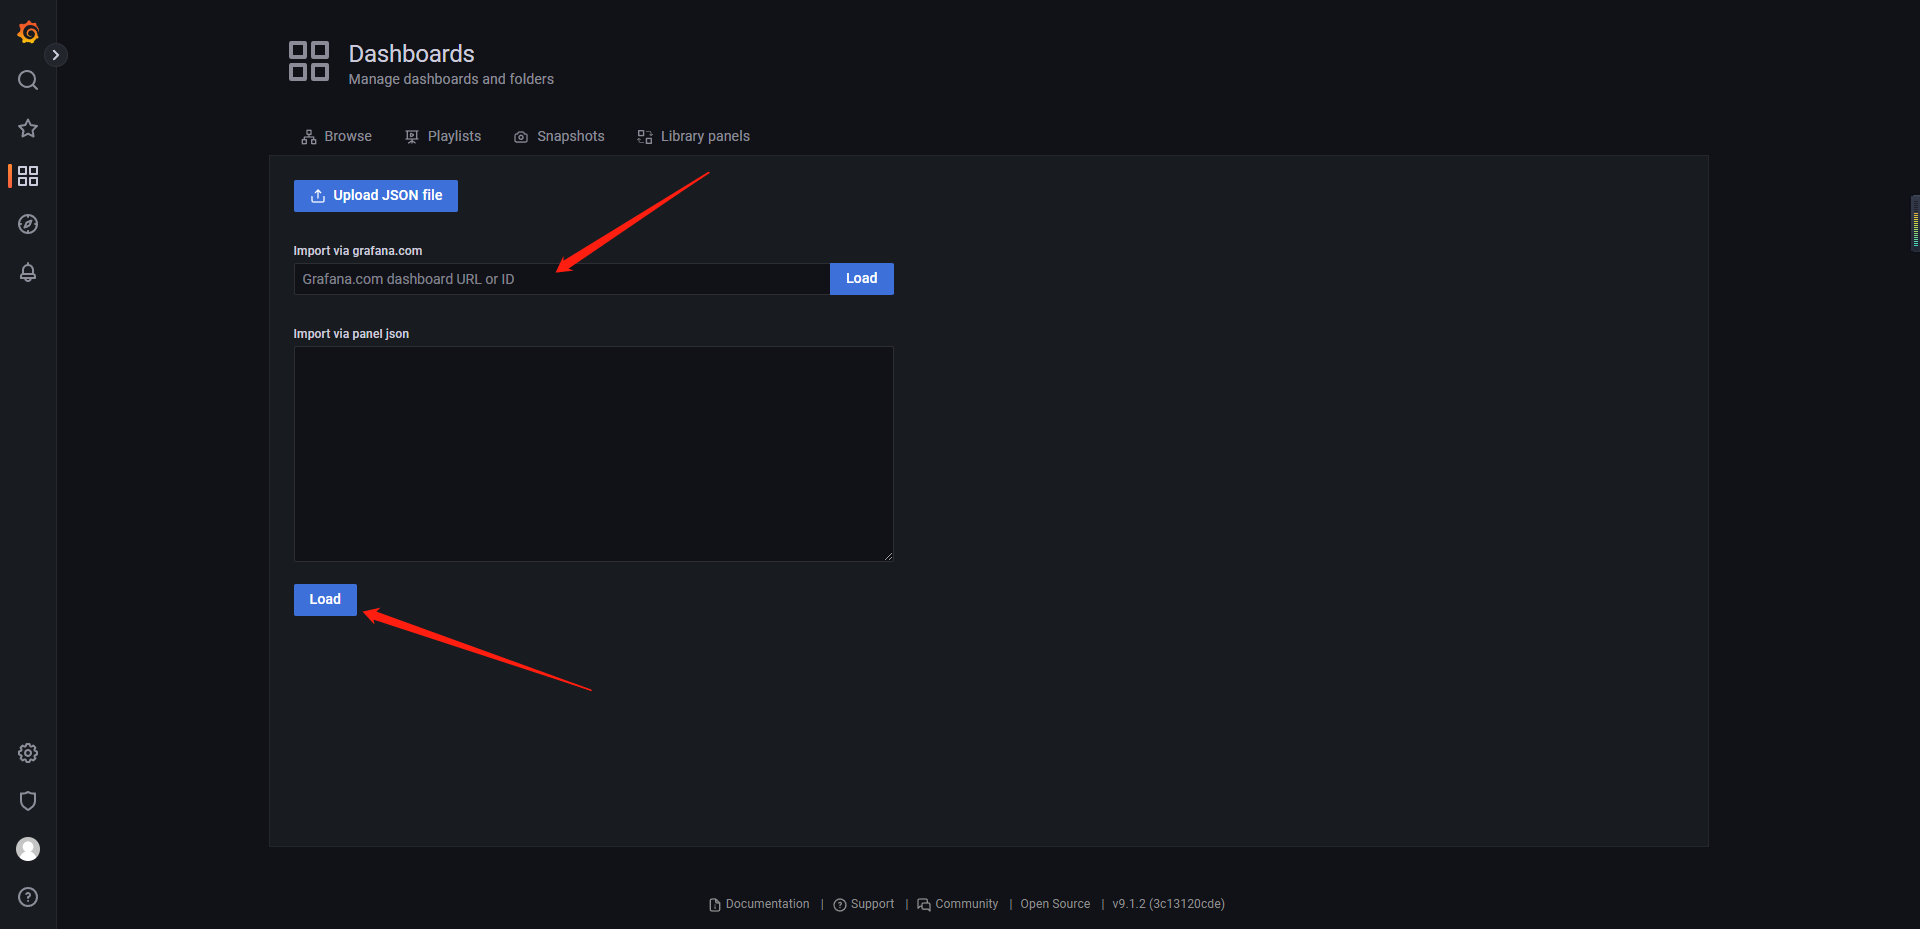
大功完成
参考
Grafana setup and running
Prometheus【普罗米修斯】+Grafana部署企业级监控(一)
Prometheus+Grafana监控
Prometheus OVERVIEW